
For today’s trade of the day we will be looking at a Daily Price chart for Harrow Health, Inc. (HROW), states Chuck Hughes of Hughes Optioneering.
Before breaking down HROW’s daily price chart let’s first review which products and services are offered by the company. Harrow Health, Inc., an eyecare pharmaceutical company, focuses on discovering, developing, and commercializing ophthalmic therapies. The company offers ImprimisRx, an ophthalmology outsourcing and pharmaceutical compounded medications.
Now, let’s begin to break down the Daily Price chart for HROW. Below is a Daily Price Chart with the price line displayed by an OHLC bar.
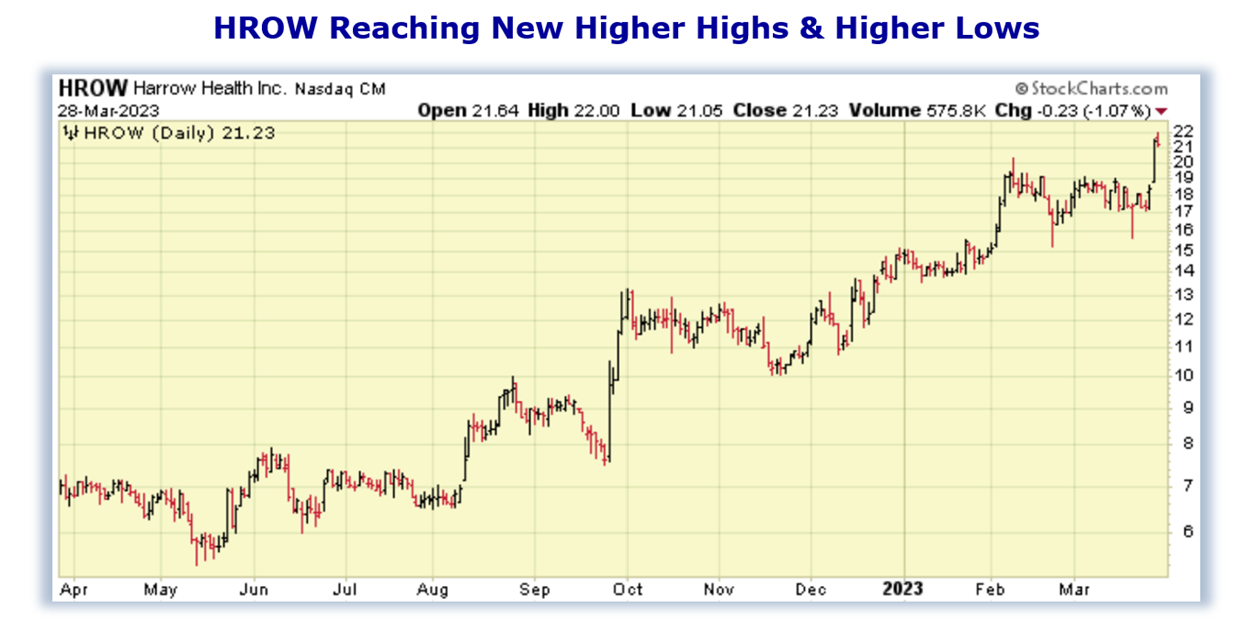
Buy HROW Stock
The Daily Price chart above shows that HROW stock began reaching a series of higher highs and higher lows since mid-December. This pattern of bullish trading suggests the stock will march on to a further advance. You see, after a stock makes a series of two or more higher highs and higher lows, the stock typically continues its price-up trend and should be purchased.
Our initial price target for HROW stock is 24.50 per share.
Profit if HROW Is Down 10%
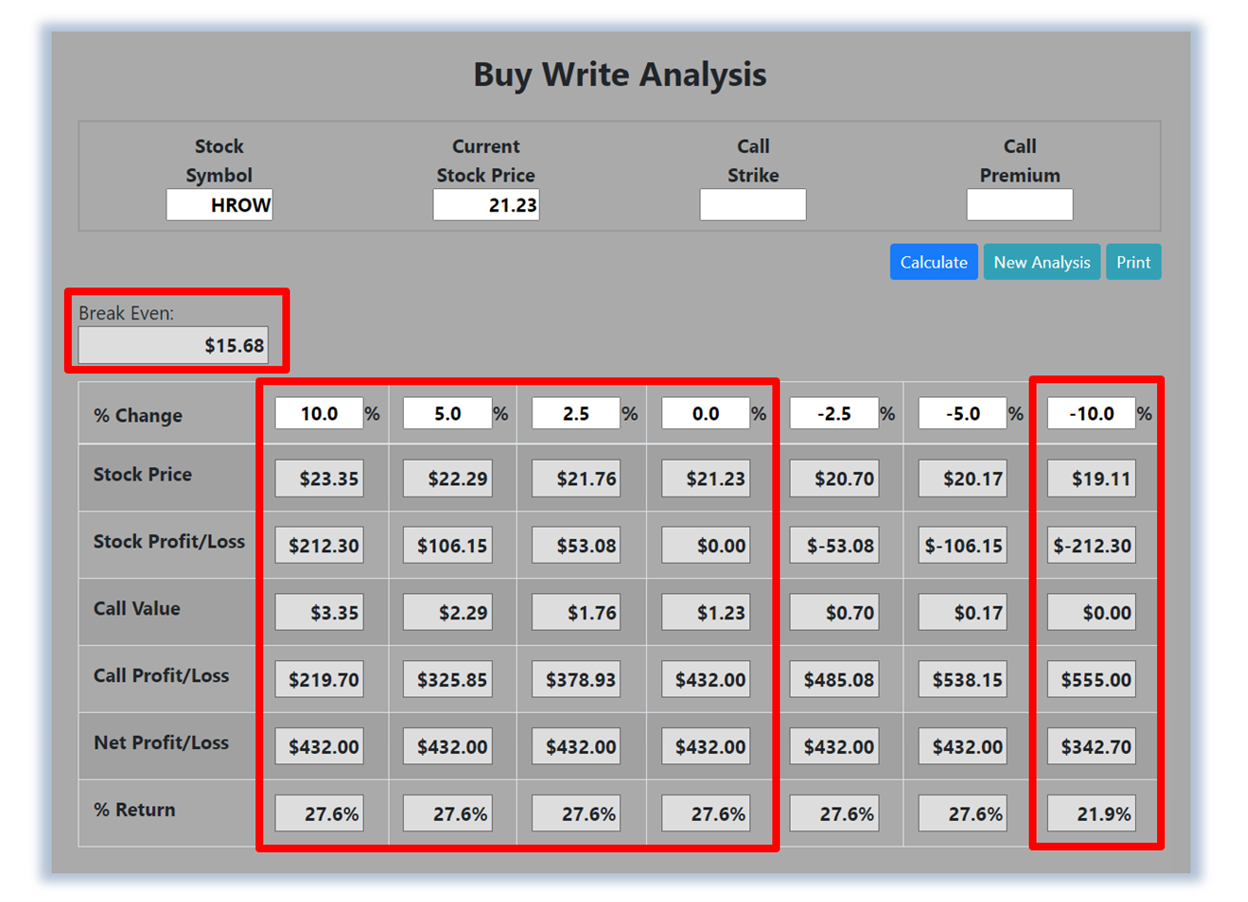
Now, since HROW is currently making a series of higher highs and higher lows and will likely rally from here, let’s use the Optioneering calculator to look at the potential returns for a HROW-covered call trade. Covered calls are also known as buy writes. The Buy Write Calculator will calculate the profit/loss potential for a covered call trade based on the price change of the underlying stock/ETF at option expiration in this example from a 10.0% increase to a 10.0% decrease in HROW stock at option expiration.
The goal of this example is to demonstrate the ‘built-in’ profit potential for covered calls and the ability of covered calls to profit if the underlying stock is up, down, or flat at option expiration. Out of fairness to our paid option service subscribers we don’t list the option strike price used in the profit/loss calculation. The prices and returns represented below were calculated based on the current stock and option pricing for HROW on 3/28/2023 before commissions.
Built-in Profit Potential
For this covered call, the calculator analysis below reveals the cost or the breakeven price is $1,568.00 (circled). The maximum risk for a covered call is the cost of the covered call. The analysis reveals that if HROW is flat at 21.23 or up at all at expiration the covered call will realize a $432.00 profit and a 27.6% return (circled). If HROW decreases 5.0% at option expiration, the covered call will realize a $432.00 profit and a 27.6% return. And if HROW decreases 10.0% at option expiration, the covered call will realize a $342.70 profit and a 21.9% return.
Due to option pricing characteristics, this covered call had a ‘built-in’ 27.6% profit potential when the trade was identified. Covered call trades can result in a higher percentage of winning trades than a directional stock trade if you can profit when the underlying stock/ETF is up, down, or flat. A higher percentage of winning trades can give you the discipline needed to become a successful trader. The Optioneering Team is here to help you identify profit opportunities just like this one.