

These tiny banks have been in trouble for quite some time. That we know. The question has been more about whether or not the selling spills into other parts of the market, states JC Parets of AllStarCharts.com.
So far it has not. The spikes in volatility in the bond market, for example, have only resulted in volatility in these little banks. We have not seen it spill into other asset classes, and certainly not in the majority of stocks. Remember, the S&P 500 (SPX) and Nasdaq100 just closed the month of April at the highest levels in a year.
Where's the volatility? The Cboe SPX Volatility Index (VIX) just closed at new 52-week lows last week. So here's the deal. This is what Regional Banks and Community Banks look like right now: Major tops, completing, and collapsing.
These are classic bullish to bearish reversal patterns:
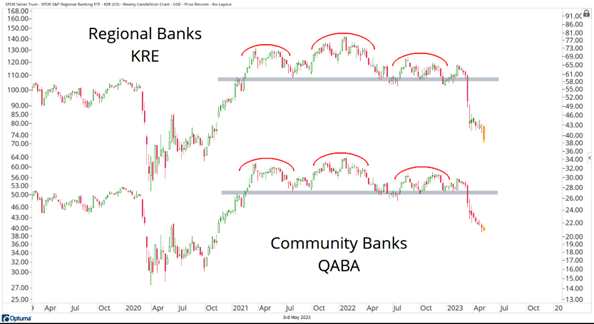
I keep being told that these are the canaries in the coal mine. There's never just one cockroach, right? Well, if these are canaries and cockroaches, then we should see the selling spill into more important areas of the market, with real market caps.
Here is the US Financials sector index, which isn't as ugly as the SPDR S&P Regional Banking ETF (KRE) & First Trust NASDAQ ABA Community Bank Index Fund (QABA) charts above. But it's not pretty. Nothing good happens to this market if Financials break last summer's lows:
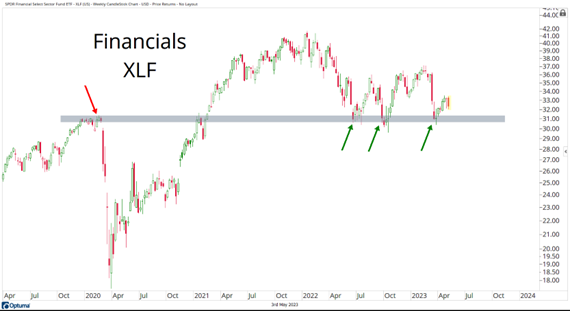
You may as well throw Small-caps into that same bucket. If the past ten months of stock prices appreciating was just a "counter-trend rally", or "Bear Market rally", as I keep being told, then you're going to see Financials and Small-caps break their summer lows.
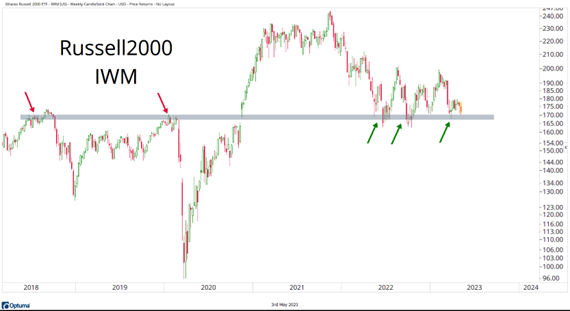
These indexes are front and center right now. The majority of stocks have been going up since last summer. If there's trouble on the horizon, the laggards are going to show us the market's true colors. Financial Select Sector SPDR (XLF) and iShares Russell 2000 ETF (IWM) are that, in my opinion.
Now for the good. Gold continues to make new all-time highs. We saw the highest quarterly close of all time for Gold Futures last month. And just last week we saw Gold Futures put in their highest monthly close of all time.
These are not characteristics of downtrends:
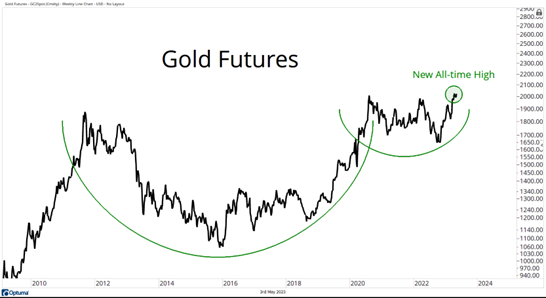
This is not a bad-looking chart. But we want to see a confirmed breakout holding above its 2020 highs to feel more confident about adding to our gold & silver positions.
To learn more about JC Parets, please visit AllStarCharts.com.


