

The market closed well Friday, with only three of the eleven S&P SPDR sectors finishing higher for the week, notes Bonnie Gortler of bonniegortler.com.
Technology (XLK) and Communication Services (XLC) were the best sectors for the second week in a row, while Materials (XLB) and Consumer Staples lagged (XLP) with the SPDR S&P 500 ETF Trust (SPY) up +0.33%.
S&P SPDR Sector ETFs Performance Summary 5/19/23-05/26/23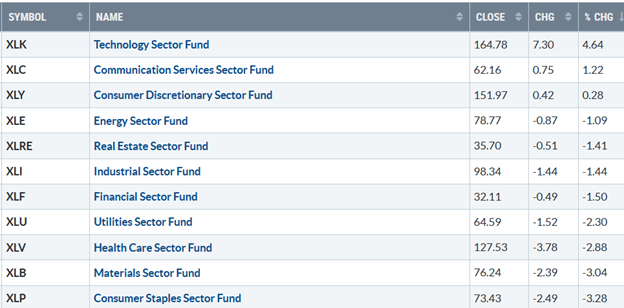
Source: Stockcharts.com
Figure 2: Bonnie’s ETFs Watch List Performance Summary 5/19/23-05/26/23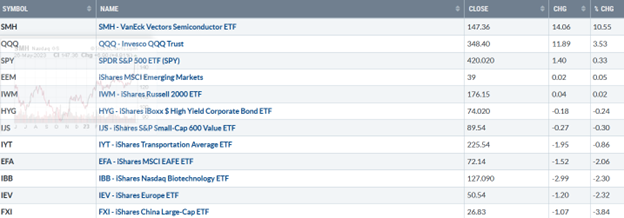
Source: Stockcharts.com
Semiconductors surged, led by NVIDIA earnings beating and exceeding investor expectations about the future. Technology continues to be the strongest sector in 2023 after a miserable 2022. Biotechnology and International stocks were weak.
Figure 3: CBOE Volatility Index VIX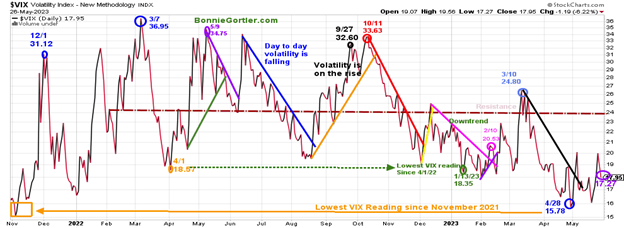
Source: Stockcharts.com
The CBOE Volatility Index (VIX), a measure of fear, traded above 20.00 for most of 2022, with a high at 36.95 on 3/7 (blue circle) and a low on 4/1/22 at 18.57. A new VIX low did not occur until 1/13/23 at 18.35 (green circle). The volatility Index (VIX) rose but closed near its low last week, with VIX (purple circle) closing at 17.27. Watch for increasing daily fluctuations and a more severe pullback if VIX closes above 20.00 and then closes above 24.00.
Figure 4: UST Ten-Year Bond Yields Daily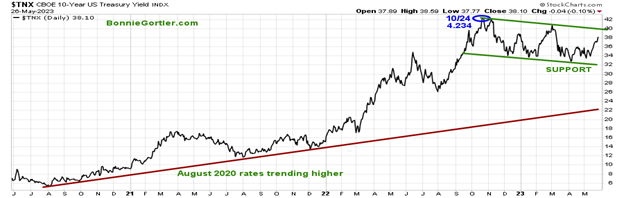
Source: Stockcharts.com
The Ten-Year US Treasury yields continued to climb last week, closing at 3.810%. Support remains at 3.20%, with resistance at 4.00%. A close above would likely put pressure on equities. The major market averages were mixed last week. The Dow fell -1.00%, lagging the other major averages, the S&P 500 up +0.32%, and the Nasdaq gained +2.51%. The Russell 2000 Index fell slightly, down -0.04%.
Figure 5: Value Line Arithmetic Average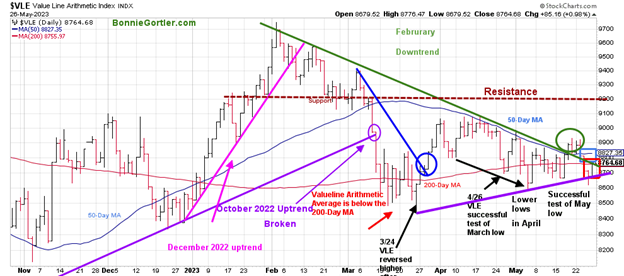
Source: Stockcharts.com
The Value Line Arithmetic Index is a mix of approximately 1700 stocks. VLE broke the October 2022 uptrend in early March, headed lower, and on 3/24, bottomed and reversed higher.
VLE fell -0.80%, failed to follow through after the breakout of the February downtrend (green circle) but successfully tested the May low again. VLE closed below the 50-Day MA (blue rectangle) and slightly below the 200-Day MA.
Key resistance remains at 9200, and support is at 8700, 8650, and 8600. It would be negative if the Value Line Index closed below the 3/24 low at 8466, a warning a significant decline could begin.
MarketBreadth Weakens
Weekly market breadth was negative on the New York Stock Exchange Index (NYSE) and for the Nasdaq. The NYSE had 1200 advances and 1934 declines, with 118 new highs and 214 new lows. There were 2207 advances and 2685 declines on the Nasdaq, with 286 new highs and 362 new lows.
For the advance to broaden to other sectors, you want to see an expansion in the weekly number of New Highs and the number of weekly New Lows to contract.
Figure 6: NYSE Cumulative Advance-Decline Line and New York Stock Exchange Index (Below)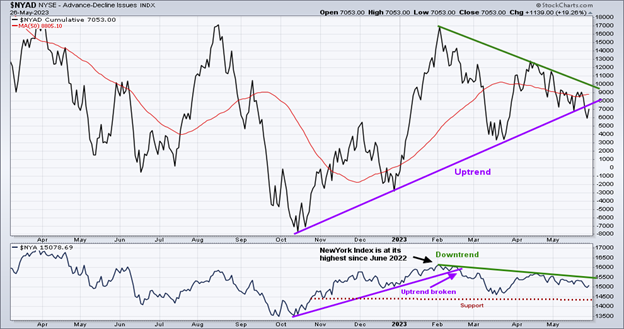
Source: Stockcharts.com
The top chart is the Cumulative Advance-Decline Line (AD Line) of the NYSE, a breadth indicator based on the number of advancing stocks minus the number of declining stocks.
The AD Line peaked in February 2023 (green circle top chart) and has fallen as the S&P 500 and Nasdaq rose.
It’s a negative sign that last week the uptrend from October broke. I want to see an immediate improvement in the NYSE Advance-Decline Line this week, breaking the downtrend from February (green line) and the New York Index (below chart) to break the downtrend, to confirm the advance will broaden.
February downtrend in AD-Line broken but no follow through and turns down.
Figure 7: Nasdaq Advance Decline Line Daily (Top) and Nasdaq (Bottom)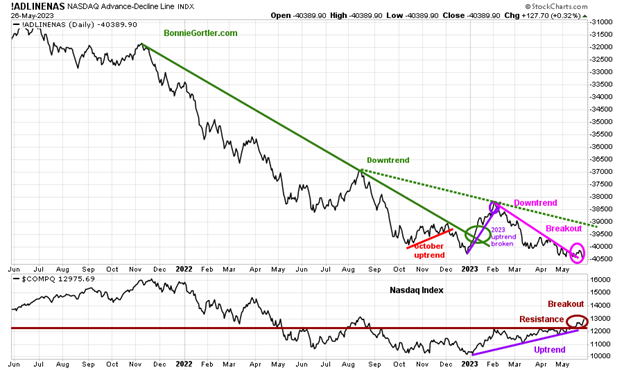
Source: Stockcharts.com
The chart is the Nasdaq Daily Advance-Decline Line, a technical indicator that plots the difference between the number of advancing and declining stocks. In January, the October 2022 downtrend was broken (green line). However, the improvement in the market breadth was short-lived, with the Nasdaq Advance-Decline line deteriorating in February 2023 (pink line top chart) as the Nasdaq (bottom chart) moved higher. Despite the February downtrend broken the previous week (pink circle), breadth turned down without breaking the August downtrend (green dotted line), clearly showing the rise in Nasdaq is not broadening.
Figure 8: Daily New York Stock Exchange (NYSE) New Lows 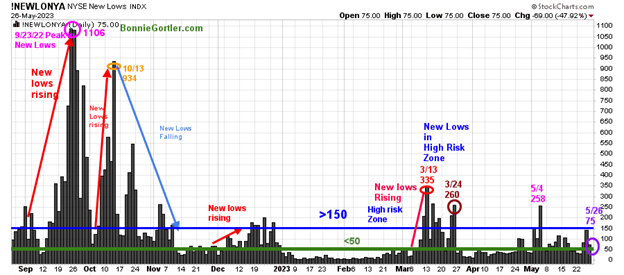
Source: Stockcharts.com
Watching New Lows on the New York Stock Exchange is a simple technical tool that helps awareness of the immediate trend's direction. New lows warned of a potential sharp pullback, high volatility, and "panic selling" for most of 2022, closing above 150. The peak reading was 9/23/22 when New Lows made a new high of 1106 (pink circle), and New Lows expanded to their highest level in 2023 on 3/13 (red circle) to 335, which have not been taken out in late March or during the weakness in early May.
New Lows rose last week, closing at 75 (purple circle), remaining below the high-risk zone of >150 (blue horizontal line), but is not yet in the low-risk zone between 25 and 50. I want New Lows to fall to the lowest risk zone below 25 and stay there. Also, seeing an increase of the New Highs to more than 203 will imply a sign of a potential broadening rally to begin. On the other hand, two closes above 150 New Lows would imply an increased risk of a decline forthcoming.
Small Caps downtrend broken but no follow through.
Figure 9: Daily iShares Russell 2000 (IWM) Price (Top) and 12-26-9 MACD (Middle and Money Flow (Bottom)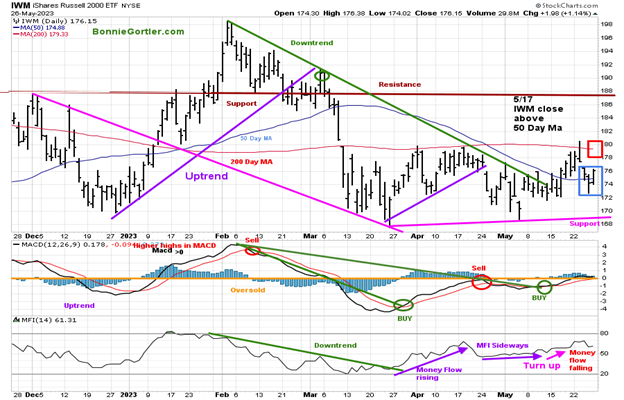
Source: Stockcharts.com
The top chart is the daily iShares Russell 2000 Index ETF (IWM), the benchmark for small-cap stocks, with a 50-Day Moving Average (MA) (blue line) and 200-Day Moving Average (MA) (red line) that traders watch and use to define trends. IWM continues to underperform due to a high concentration in Regional Banks, closing at 176.15, up +0.02%. The IWM February downtrend was broken (solid green line), but IWM stalled at the 200-Day MA (red rectangle) last week and turned down. IWM fell below the 50-Day MA (blue rectangle) before recovering to end the week above.
Resistance remains at 180.00 and 188.00, where IWM broke down in March. Support is at 172.00, 169.00, and 166.00.
MACD is on a buy and is above 0 but not showing much strength. Money Flow (lower chart) is falling, no longer positive after rising, at the beginning of May. It would be favorable and likely to attract more buying if IWM can close above resistance at 180.00 and then close above 188.00 with a turn-up in Money Flow.
Nasdaq Breakout
Figure 10: Nasdaq Composite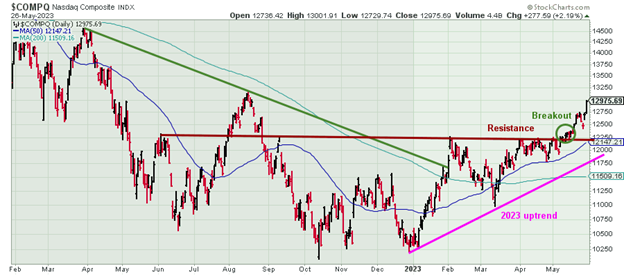
Source: Stockcharts.com
Nasdaq penetrated resistance of 12300 and continues to move higher in an uptrend, closing at 12975.69, up 2.41% last week.
Overhead Resistance Remains
Figure 11: Dow Jones Industrial Average 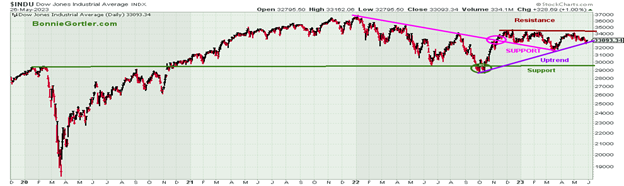
Source: Stockcharts.com
The Dow Jones Industrial Average continues to lag and has underperformed in 2023 closing lower by -1.00% at 33093.34, remaining below resistance at 34250. A close above resistance for two days could fuel bargain-hunting by investors.
Figure 12: Daily Vaneck Vectors Semiconductors (SMH) Price (Top) and 12-26-9 MACD (Middle) and Money Flow (Bottom)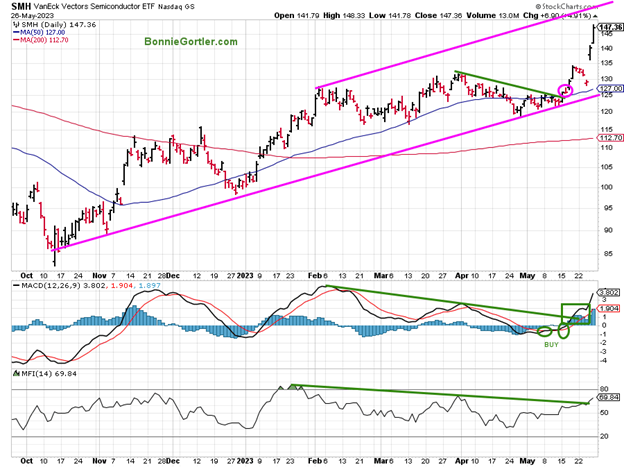
Source: Stockcharts.com
Semiconductors (SMH) rocked last week, continuing its strength since breaking its April daily downtrend in May. Its positive MACD (middle chart) confirms the new high and that Money Flow continues to rise, breaking the January downtrend (green line). The daily channel objective is 155.00, with support at 135.00. Semiconductors break out for the intermediate term.
Figure 13: Weekly Vaneck Vectors Semiconductors (SMH) Price (Top) and 12-26-9 MACD (Middle) and Money Flow (Bottom)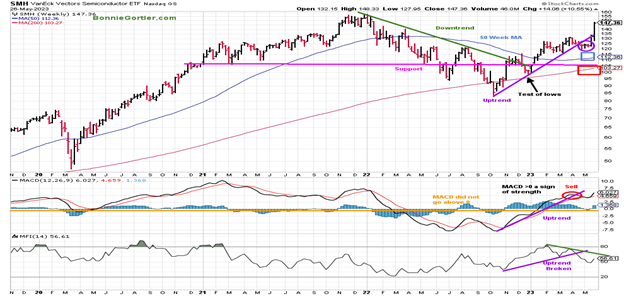
Source: Stockcharts.com
The top chart shows the Weekly Semiconductors ETF, concentrated mainly in US-based Mega-Cap Semiconductors companies. SMH tends to be a lead indicator for the market when investors are willing to take on increased risk and the opposite when the market is falling. SMH broke its downtrend in October 2022 (green line) and retraced the breakout in late December and March.
SMH surged higher, rising +10.55% after +8.46% the previous week, led by Nvidia and Marvel earnings beating and exceeding expectations. SMH remains well above the 50 and 200-week MA (blue and red rectangle), a sign of strength but short-term overbought. MACD, (the middle chart) is on a sell with momentum rising, confirming the 2023 new high made in SMH. Money Flow (MFI) turned up after falling after breaking the October uptrend in April but below the highs of February.
Summary
A clear breakout in Semiconductors.has occurred. A tremendous run in SMH the past two weeks created an overbought condition this week. With the end of the month only a few days away and quarterly window dressing in June, look for higher prices with a short-term objective of 155.00. Two closes above would give a higher objective of 185.00.
SMH Relative Strength vs. QQQ makes a new high
Figure 14: VanEck Vectors Semiconductor/Invesco QQQ Trust (SMH/QQQ) Weekly Relative Strength Index Ratio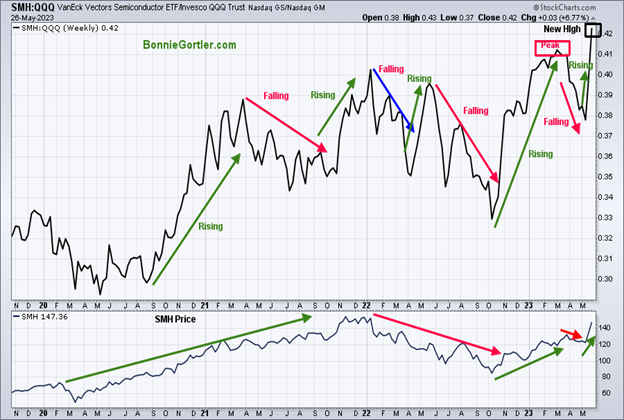
Source: Stockcharts.com
The top part of the chart is the weekly VanEck Vectors Semiconductor/Invesco QQQ Trust (SMH/QQQ) Index Ratio. A rising line means the SMH is stronger, and if falling, the QQQ is stronger. The SMH/QQQ ratio peaked in March, but last week Semiconductors outperformed QQQ, and the (SMH/QQQ) Index Ratio made a new high which confirms the breakout in SMH and bodes well for the market in the short term.
Figure 15: Daily Invesco QQQ Trust (QQQ) Price (Top) and 12-26-9 MACD (Middle) and Money Flow (Bottom)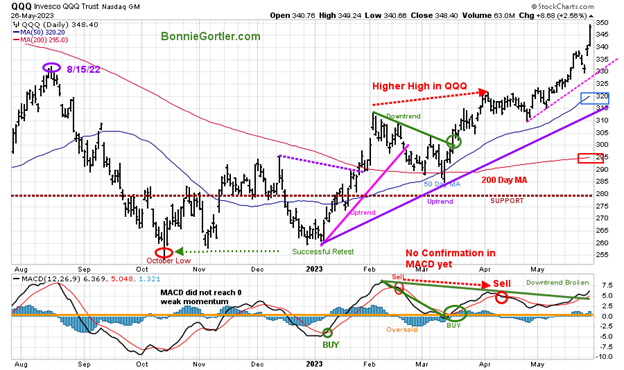
Source: Stockcharts.com
The chart shows the daily Invesco QQQ, an exchange-traded fund based on the Nasdaq 100 Index. QQQ made a low in October 2022 (red circle), followed by a successful retest of the low in early January 2023. The 2023 uptrend remains in effect.
QQQ rose +3.53% last week, closing at 348.40, near its high for the week, closing well above the 50-Day Moving Average and the 200-Day Moving Average (red rectangle). QQQ continues strengthening above the old high made in August 2022 (purple circle) after moving above resistance at 331.16. Support is at 340.00, 335.00, and 325.00.
The bottom chart is MACD (12, 26, nine), a measure of momentum that remains on a sell because MACD didn’t fall below 0. It’s favorable if MACD continues to rise, breaking the February downtrend and taking out the April highs confirming the high made-in price. With QQQ continuing the pattern of higher lows and higher highs, the benefit of the doubt remains with the bulls.
Figure 16: Weekly Invesco QQQ Trust (QQQ) Price (Top) and 12-26-9 MACD (Bottom)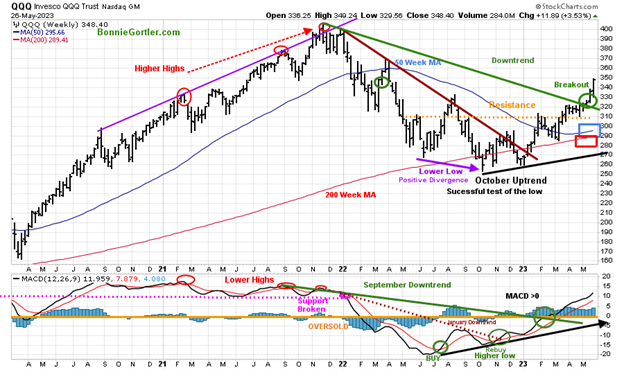
Source: Stockcharts.com
The intermediate trend remains up. QQQ broke the November 2022 weekly price downtrend (green line top chart) and closed above the August 2022 highs. Its positive QQQ continues its pattern of higher lows and higher highs, closing above the 50 and 200 Week MA and remaining above the old resistance at 310.00 (orange dotted line), acting as major support. MACD remains above 0, rising to a new high, confirming the breakout in QQQ.
Figure 17: The S&P 500 Index (SPY) Daily (Top) and 12-26-9 MACD (Bottom)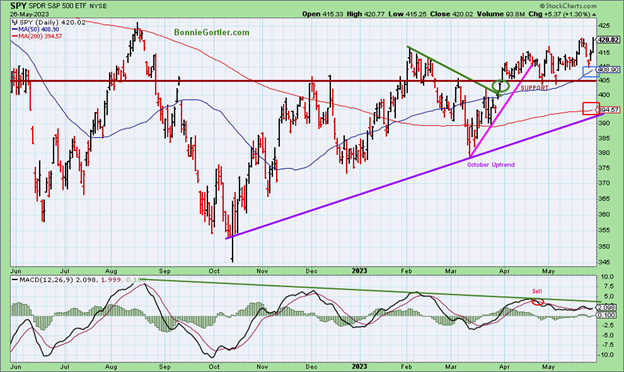
Source: Stockcharts.com
The SPY remains in an uptrend from October 2022, closing at its highest level in none months last week. SPY rose +0.33%, closing near its high for the week after early weakness early in the week. SPY remains above the current trading range above the 50-Day Moving Average (blue rectangle) and the 200-Day Moving Average (red rectangle), a sign of underlying strength. MACD (bottom chart) remains on a sell as it never went below 0 to generate a new buy. Resistance is at 425.00. Support is at 415.00, 405.00, and 400.00. The bulls are in control as long as SPY remains above 405.00.
Figure 18: Daily SPDR S&P 500 ETF Trust (SPY), (Top) and below SPDR S&P MidCap 400 (MDY), iShares Core S&P Small-Cap (IJR), and iShares Micro-Cap (IWC) ETF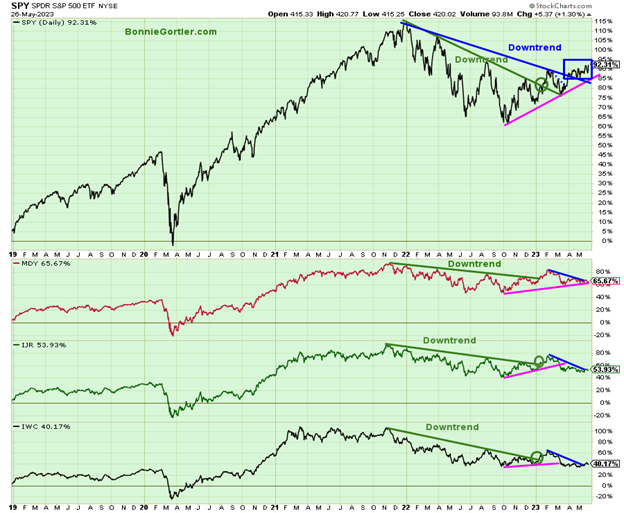
Source: Stockcharts.com
The above chart is (SPY, SPDR S&P MidCap 400 ETF, iShares Core S&P Small-Cap, and iShares Micro-Cap. All four ETFs broke the longer-term downtrends earlier this year (green lines), but the rally has been narrow in 2023, with SPY the strongest, trading above the February downtrend (blue line) and breaking out (blue rectangle).
Not much change last week. There is more work to do for confirmation of a broader rally. You want to see the downtrends breaking in MDY, IJR, and IWC this week and price stronger than the SPY to confirm the breakout.
In Closing
US debt ceiling negotiations continued after the market closed Friday, with a tentative debt ceiling agreement reached on Saturday evening. Nasdaq continued its leadership as the Semiconductors broke out. Look for market breadth to improve for the rally to broaden. It’s a positive sign momentum patterns are rising, which implies higher prices in the near term, as the end of the month is here, and quarterly window dressing is likely to begin.
Remember to manage your risk, and your wealth will grow.
Do you like charts? I invite you to my FB group Wealth Through Market Charts or email me at Bonnie@Bonniegortler.com.
Disclaimer: Although the information is made with a sincere effort for accuracy, it is not guaranteed that the information provided is a statement of fact. Nor can we guarantee the results of following any of the recommendations made herein. Readers are encouraged to meet with their advisors to consider the suitability of investments for their particular situations and the determination of their risk levels. Past performance does not guarantee any future results.


