
For today’s Trade of the Day e-letter we will be looking at a daily price chart for CrowdStrike Holdings, Inc. (CRWD), states Chuck Hughes of Hughes Optioneering.
Before breaking down CRWD’s daily chart let’s first review what products and services the company offers. CrowdStrike Holdings, Inc. provides cloud-delivered protection across endpoints and cloud workloads, identity, and data. It offers corporate workload security, security and vulnerability management, managed security services, IT operations management, threat intelligence services, identity protection, and log management.
Now, let’s begin to break down the Daily Price chart for CRWD stock. Below is a Daily Price chart with the 50-Day EMA and 100-Day EMA for CRWD.
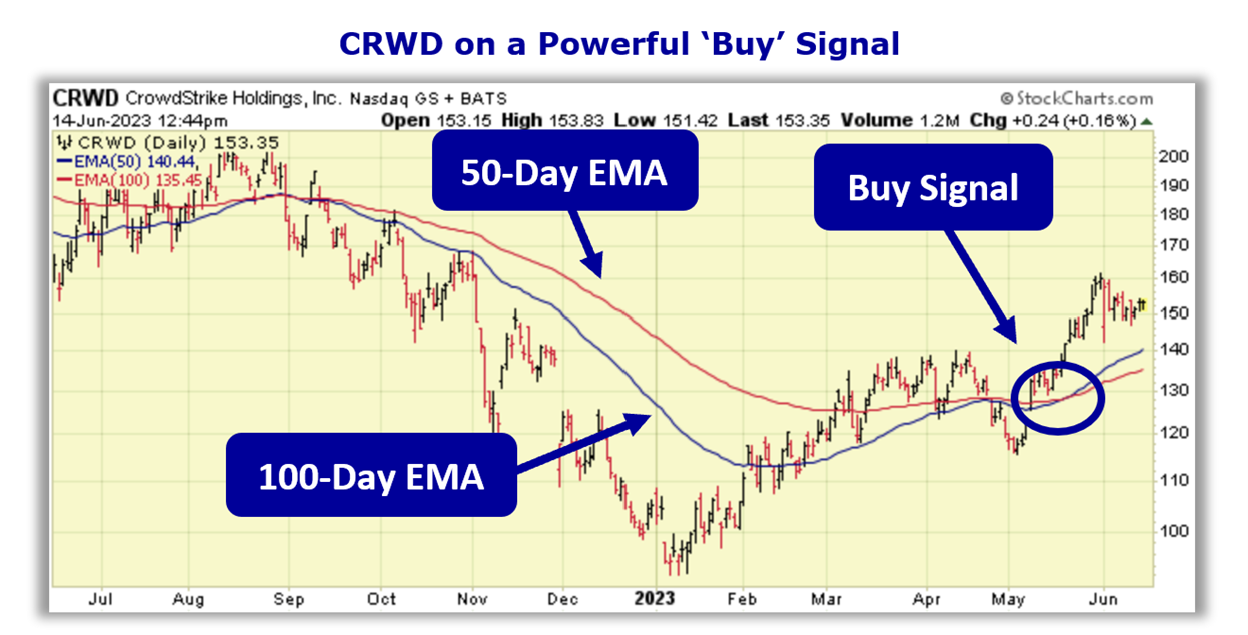
50-Day EMA and 100-Day EMA ‘Buy’ Signal
The 50-Day Exponential Moving Average (EMA) and 100-Day EMA are moving average indicator lines that can provide buy and sell signals when used together. When the shorter-term 50-Day EMA crosses above or below the longer-term 100-Day EMA, this provides either a buy or sell signal depending on which direction the stock price is moving.
- 50-Day EMA line Above 100-Day EMA = Price Uptrend = Buy signal
- 50 Day EMA line Below 100-Day EMA = Price Downtrend = Sell signal
When the 50-Day EMA (blue line) crosses above the 100-Day EMA (red line) this indicates that the stock’s buying pressure has begun to outweigh the selling pressure signaling a ‘buy’ signal. When the 50-Day EMA crosses below the 100-Day EMA this indicates that the selling pressure has begun to outweigh the buying pressure signaling a ‘sell’ signal.
Buy CRWD Stock
As the chart shows, on May 19th, the CRWD 50-Day EMA, crossed above the 100-Day EMA. This crossover indicated the buying pressure for CRWD stock exceeded the selling pressure. For this kind of crossover to occur, a stock has to be in a strong bullish trend.
Now, as you can see, the 50-Day EMA is still above the 100-Day EMA meaning the ‘buy’ signal is still in play. As long as the 50-Day EMA remains above the 100-Day EMA, the stock is more likely to keep trading at new highs and should be purchased. Our initial price target for CRWD stock is 175.00 per share.
71.8% Profit Potential for CRWD Option
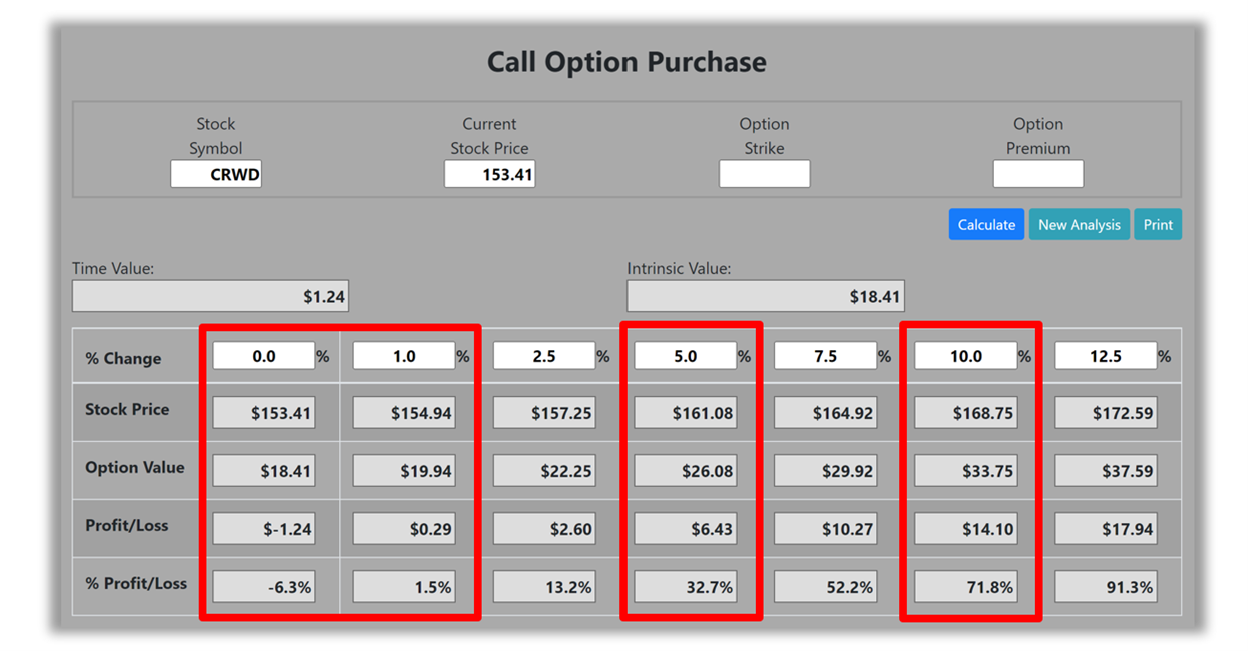
Now, since CRWD’s 50-Day EMA is trading above the 100-Day EMA this means the stock’s bullish rally will likely continue. Let’s use the Hughes Optioneering calculator to look at the potential returns for a CRWD call option purchase. The Call Option Calculator will calculate the profit/loss potential for a call option trade based on the price change of the underlying stock/ETF at option expiration in this example from a flat CRWD price to a 12.5% increase.
The Optioneering Team uses the 1% Rule to select an option strike price with a higher percentage of winning trades. In the following CRWD option example, we used the 1% Rule to select the CRWD option strike price but out of fairness to our paid option service subscribers, we don’t list the strike price used in the profit/loss calculation.
Trade with Higher Accuracy
When you use the 1% Rule to select a CRWD in-the-money option strike price, CRWD stock only has to increase by 1% for the option to break even and start profiting! Remember, if you purchase an at-the-money or out-of-the-money call option and the underlying stock closes flat at option expiration it will result in a 100% loss for your option trade! In this example, if CRWD stock is flat at 153.41 at option expiration, it will only result in a 6.3% loss for the CRWD option compared to a 100% loss for an at-the-money or out-of-the-money call option.
Using the 1% Rule to select an option strike price can result in a higher percentage of winning trades compared to at-the-money or out-of-the-money call options. This higher accuracy can give you the discipline needed to become a successful option trader and can help avoid 100% losses when trading options.
The goal of this example is to demonstrate the powerful profit potential available from trading options compared to stocks. The prices and returns represented below were calculated based on the current stock and option pricing for CRWD on 6/14/2023 before commissions.
When you purchase a call option, there is no limit on the profit potential of the call if the underlying stock continues to move up in price. For this specific call option, the calculator analysis below reveals if CRWD stock increases 5.0% at option expiration to 161.08 (circled), the call option would make 32.7% before the commission.
If CRWD stock increases 10.0% at option expiration to 168.75 (circled), the call option would make 71.8% before the commission and outperform the stock return by more than seven to one. The leverage provided by call options allows you to maximize potential returns on bullish stocks.
The Hughes Optioneering Team is here to help you identify profit opportunities just like this one.