

There is no doubt a pullback is taking place as the S&P 500 (SPX) is a good spot off the recent highs found at the end of July. Since then, the large-cap index has given back around 4% with small caps and other Risk On positions seeing even worse results, states Steve Reitmeister of Reitmeister Total Return.
The key questions currently are: Where is the bottom? And when will we get there? We will explore these vital topics in this week's Reitmeister Total Return commentary.
Market Commentary
We are going to tackle commentary in reverse order today...first, explore the price action, then talk about the fundamentals driving the price. As noted above, stocks topped out near 4,600 at the end of July. Since then, it has been an ongoing process to find the bottom:
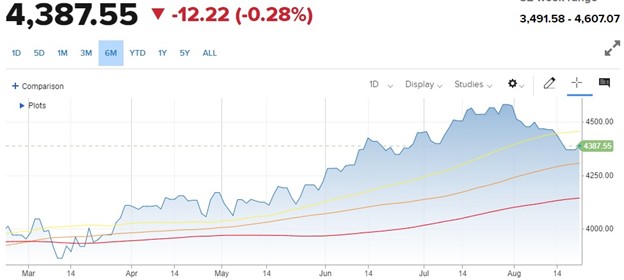
Moving Averages: 50 Day (yellow), 100 Day (orange), 200 Day (red)
Stocks cut through the 50-day moving average like a hot knife through butter and have not looked back. A deeper washout was needed given five straight months of excellent gains. Next up we had psychological support at 4,400. That too did not hold. Then came up just short of breaking back above on Monday followed by another failed test on Tuesday. That makes three straight closes below 4,400. This means we now likely have to contemplate whether the 100-day moving average at 4,305 will hold as support and bottom of the range. We got fairly close on Friday with an intraday strike down to 4,335 before a bounce ensued.
My gut tells me it wouldn’t take much to dive another 2% to test that 100-day moving average. That likely is as far as we need to go given the fundamental story in hand. This means that a test of the long-term trend line (200-day MA) at 4,136 seems likely overkill at this time. Probably the 100-day moving average is as far as we need to go. Getting as low as the 200-day moving average is plausible only if the economic events from here come in much worse than expected. Thus, a good time to switch to the fundamental picture of the market.
Fundamental Picture
My main thesis is that we have a long-term bull market unfolding as the Fed does look on track with a soft landing as they bring inflation down to size. Don’t thank the Fed...they have been doing their level best to create unemployment and a recession. The main reason a recession has not unfolded...and likely won’t happen, is that the two-four million early retirees during Covid created an employment shortage. Anybody who wants a job can pretty much find one leading to a historically low unemployment rate that has not buckled under the pressure of 1.5 years of intense rate hikes.
Unfortunately, this thesis includes the fact that bulls got way ahead of themselves bidding stocks up to 4,600 when the economy is still soft, and earnings growth is non-existent. This led to an elevated PE over 20 which is too much weight for the current fundamentals to withstand. The natural conclusion given above is to have a long overdue pullback that properly resets market equilibrium at a more logical valuation. This begets a trading range between likely the 100-day moving average at 4,305 and the previous high of 4,600.
This is a comfy trading range to play around in awaiting the next key catalysts to break out. Most likely that will be a break higher as the soft landing comes together allowing the Fed to lower rates which is strong caffeine promoting higher stock prices. Yet while in the trading range, we are very susceptible to every new headline that could make us go higher one day...and lower the next. So, let’s review the key economic events before us that could provide the next catalyst for the overall market:
8/16 FOMC Minutes: This happened last week. But an important piece of information to weigh against other events down the road.
In the actual meeting on 7/25, the Fed started their “dovish tilt”. That is the acknowledgment that inflation is moderating nicely. Plus, they no longer saw a recession unfolding before they were ready to lower rates. However, the meeting minutes had a bit more language about the “potential need” to raise rates further to put the final nails in the high inflation coffin.
Given that the market was already amid a pullback, this was just another reason to hit the sell button. Yet really, the language of the minutes was no more hawkish than any statement made by the Fed in the past to give themselves whatever flexibility necessary to win the battle over inflation.
All in all, the pathway is there for the Fed to not have to raise rates further and create a soft landing for the economy which leans bullish in the long run.
8/23 PMI Flash: This report rarely makes headlines, but is a strong leading indicator of the trends found in the next round of ISM Manufacturing and Services reports the first week of the new month. Thus, it is always beneficial to review this announcement to appreciate if the odds of a recession are going higher or lower. Right now, investors expect this reading to be the same as last month at 52 with services in better shape than manufacturing.
9/1 Government Employment Situation: The job add expectations continue to ebb lower as the Fed rate hikes slow down the economy. But gladly has not tipped over into negative territory that would raise the unemployment rate...and risk of recession. Right now, the forecast calls for 180,000 jobs to be added which would be a very “Goldilocks” outcome where the unemployment rate would stay low. On the other hand, not so many jobs were created as to heat wage inflation that would concern the Fed.
9/1 ISM Manufacturing: This has been the weakest part of the economic picture with nine straight readings in contraction territory (below 50). Right now, it seems that June may be the worst of these readings with July a notch higher...and the August reading on September first is expected to be another step in the right direction.
9/6 ISM Services: This is the larger, and healthier part of the economy leading to the positive GDP readings. It is currently expected to be somewhat in line with last month’s 52.7 reading, which is modest in expansion territory. Yet I think the impressive mid-month reading for Retail Sales may lead to a topping of current ISM Service expectations.
9/13 Consumer Price Index (CPI): Inflation reports are the most telling of what the Fed will do with future rate hike decisions. Gladly this key inflation report has been moderating faster than expected for quite some time. Thus, that positive trend staying in place will be key to reigniting bullish sentiment. And will have a fair amount to do with the next item...
9/20 Fed Rate Announcement: Right now, investors place 85% odds of the Fed pressing pause on rates. And yes, this appears to be the pattern going back the past few meetings (hike > pause). Plus, the tenor of what was said at the last announcement combined with inflation reports since then came under expectations.
As always, what Powell says at the press conference has much more impact on the market than the initial rate decision. What investors will be looking for is whether the dovish tilt that started in July will be more or less dovish this time around. Obviously...the more dovish it sounds for the future...the better it is for stock prices.
Trading Plan
Fundamentally we are in a bull market. Technically in a bull market because we are well above the 200-day moving average. But yes, stocks were overdue for a stiff sell-off which is taking place now. Now we are just trying to find the bottom. Maybe already found it...but sense a test of the 100-day moving average at 4,305 could unfold.
But even at current prices, we are in a “buy the dip” scenario as the market will likely retest 4,600 early in the Fall. Then have a good shot for the Santa Claus rally to help close out the year taking a shot at the all-time high of 4,818. Now we just need to consider what are the best stocks & ETFs for this environment. And that is what the next section will tackle...


