

The chart of the day belongs to the off-shore rig services company, Tidewater (TDW), states Jim Van Meerten of BarChart.com.
I found the stock by using Barchart's powerful screening functions to find stocks with the highest technical buy signals, highest Weighted Alpha, superior current momentum and having a Trend Seeker buy signal. I then used the Flipchart feature to review the charts for consistent price appreciation. Since the Trend Seeker signaled a buy on 8/31 the stock gained 9.29%.
TDW Price vs Daily Moving Averages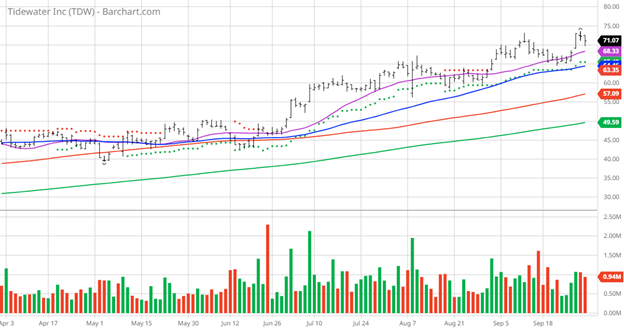
Tidewater Inc., together with its subsidiaries, provides offshore support vessels and marine support services to the offshore energy industry through the operation of a fleet of marine service vessels worldwide. It provides services in support of offshore crude oil and natural gas exploration, field development, and production, as well as windfarm development and maintenance, including towing of and anchor handling for mobile offshore drilling units; transporting supplies and personnel necessary to sustain drilling, workover, and production activities; offshore construction, and seismic and subsea support; geotechnical survey support for windfarm construction; and various specialized services, such as pipe and cable laying. The company operates anchor handling towing supply vessels, platform supply vessels, crew boats, utility vessels, and offshore tugs. The company serves oil and natural gas exploration, field development, and production companies; mid-sized and smaller independent exploration and production companies; foreign government-owned or government-controlled organizations, and other related companies; drilling contractors; and other companies, such as offshore construction, windfarm development, diving, and well stimulation companies. Tidewater, Inc. was incorporated in 1956 and is headquartered in Houston, Texas.
Barchart's Opinion Trading systems are listed below. Please note that the Barchart Opinion indicators are updated live during the session every 20 minutes and can therefore change during the day as the market fluctuates. The indicator numbers shown below therefore may not match what you see live on the Barchart.com website when you read this report.
Barchart Technical Indicators:
- 100% technical buy signals
- 204.01+ Weighted Alpha
- 223.05% gain in the last year
- Trend Seeker buy signal
- Above its 20, 50, and 100 day moving averages
- Seven new highs and up 15.67% in the last month
- Relative Strength Index 61.78%
- Technical support level at $69.87
- Recently traded at $71.07 with 50 day moving average of $64.46
Fundamental Factors:
- Market Cap $3.81 billion
- P/E 60.83
- Revenue expected to grow 56.10% this year and another 33.60% next year
- Earning estimated to increase 806.20% this year, an additional 120.10% next year and continue compounding at an annual rate of 5.00% for the next five years
Analysts and Investor Sentiment: I don't buy stocks because everyone else is buying but I do realize that if major firms and investors are dumping a stock it's hard to make money swimming against the tide:
- Wall Street analyst gave four strong buy, and one hold opinion on the stock
- Analysts' price targets are between $55 and $90 with a consensus of $79.80
- The individual investors following the stock on Motley Fool voted 652 to 39 for the stock to beat the market with the more experienced investor voting 94 to ten for the same result
- Value Line gives the stock its above average rating of three
- CFRAs MarketScope rates the stock a hold
- 8,100 investors monitor the stock on Seeking Alpha
Additional Disclosure: The Barchart Chart of the Day highlights stocks that are experiencing exceptional current price appreciation. They are not intended to be buy recommendations as these stocks are extremely volatile and speculative. Should you decide to add one of these stocks to your investment portfolio it is highly suggested you follow a predetermined diversification and moving stop loss discipline that is consistent with your personal investment risk tolerance and reevaluate your stop losses at least on a weekly basis.
On the date of publication, Jim Van Meerten did not have (either directly or indirectly) positions in any of the securities mentioned in this article. All information and data in this article is solely for informational purposes. For more information please view the Barchart Disclosure Policy here.
Learn more about Jim Van Meerten at BarChart.com.


