

The chart of the day belongs to the discount retailer Ollie's Bargain Outlets (OLLI), states Jim Van Meerten of BarChart.com.
I found the stock by using Barchart's powerful screening functions to find stocks with the highest technical buy signals, highest Weighted Alpha, superior current momentum, and having a Trend Seeker buy signal then used the Flipchart feature to review the charts for consistent price appreciation. Since the Trend Seeker signaled a buy on 11/1 the stock gained 1.55%.
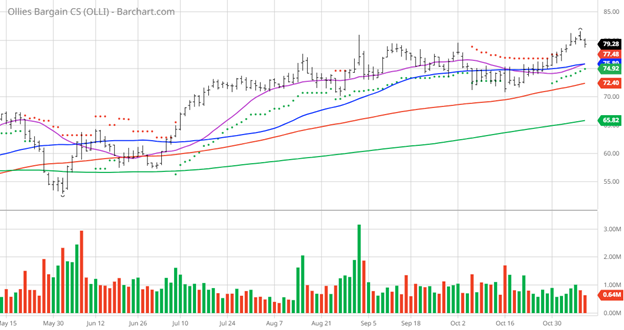
OLLI Price vs Daily Moving Averages
Ollie's Bargain Outlet Holdings, Inc. operates as a retailer of brand-name merchandise in the United States. The company offers housewares, bed and baths, food, floor coverings, health and beauty aids, books and stationery, toys, and electronics; and other products, including hardware, candy, clothing, sporting goods, pet and lawn, and garden products. It provides its products primarily under the Ollie's, Ollie's Bargain Outlet, Good Stuff Cheap, Ollie's Army, Real Brands Real Cheap!, Real Brands! Real Bargains, Sarasota Breeze, Steelton Tools, American Way, and Middleton Home names. The company was formerly known as Bargain Holdings, Inc. and changed its name to Ollie's Bargain Outlet Holdings, Inc. in March 2015. Ollie's Bargain Outlet Holdings, Inc. was founded in 1982 and is headquartered in Harrisburg, Pennsylvania.
Barchart's Opinion Trading systems are listed below. Please note that the Barchart Opinion indicators are updated live during the session every 20 minutes and can therefore change during the day as the market fluctuates. The indicator numbers shown below therefore may not match what you see live on the Barchart.com website when you read this report.
Barchart Technical Indicators:
- 100% technical buy signals
- 45.48+ Weighted Alpha
- 46.22% gain in the last year
- Trend Seeker buy signal
- Above its 20, 50, and 100-day moving averages
- 12 new highs and up 6.95% in the last month
- Relative Strength Index 63.65%
- Technical support level at $79.55
- Recently traded at $79.22 with a 50-day moving average of $75.80
Fundamental Factors:
- Market Cap $4.95 billion
- P/E 33.85
- Revenue is expected to grow 14.10% this year and another 9.20% next year
- Earnings are estimated to increase 67.90% this year, an additional 14.00% next year, and continue to compound at an annual rate of 15.10% for the next five years
Analysts and Investor Sentiment: I don't buy stocks because everyone else is buying but I do realize that if major firms and investors are dumping a stock it's hard to make money swimming against the tide:
- Wall Street analysts gave five strong buy, four buy, five hold, and one sell opinions on the stock
- Analysts' price targets are between $52 and $93 with a consensus price target of $84
- The individual investors following the stock on Motley Fool voted 102 to 5 for the stock to beat the market with the more experienced investors voting 8 to 1 for the same result
- Value Line rates it an average of three
- CFRAs MarketScope rates it a hold
- 9,590 investors monitor the stock on Seeking Alpha
Additional disclosure: The Barchart Chart of the Day highlights stocks that are experiencing exceptional current price appreciation. They are not intended to be buy recommendations as these stocks are extremely volatile and speculative. Should you decide to add one of these stocks to your investment portfolio it is highly suggested you follow a predetermined diversification and moving stop loss discipline that is consistent with your personal investment risk tolerance and reevaluate your stop losses at least every week.
On the date of publication, Jim Van Meerten did not have (either directly or indirectly) positions in any of the securities mentioned in this article. All information and data in this article is solely for informational purposes. For more information please view the Barchart Disclosure Policy here.


