

The chart of the day belongs to the rideshare and food delivery company Uber Technologies (UBER), states Jim Van Meerten of BarChart.com.
I found the stock by using Barchart's powerful screening functions to find stocks with the highest technical buy signals, highest Weighted Alpha, superior current momentum, and a Trend Seeker buy signal. I then used the Flipchart feature to review the charts for consistent price appreciation. Since the Trend Seeker signaled a buy on 1/10 the stock gained 13.08%.
UBER Price vs Daily Moving Averages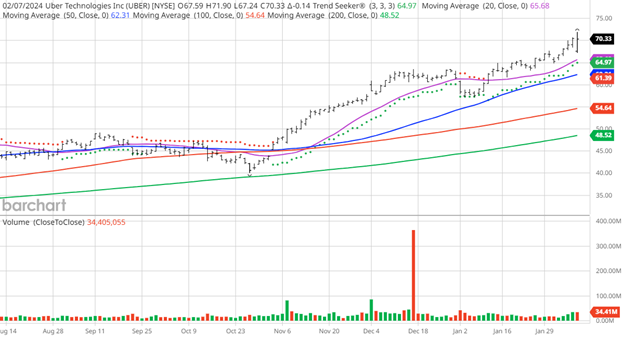
Uber Technologies, Inc. develops and operates proprietary technology applications in the United States, Canada, Latin America, Europe, the Middle East, Africa, and Asia excluding China and Southeast Asia. It operates through three segments: Mobility, Delivery, and Freight.
Barchart's Opinion Trading systems are listed below. Please note that the Barchart Opinion indicators are updated live during the session every 20 minutes and can therefore change during the day as the market fluctuates. The indicator numbers shown below therefore may not match what you see live on the Barchart.com website when you read this report.
Barchart Technical Indicators:
- 100% technical buy signals
- 118.44+ Weighted Alpha
- 102.34% gain in the last year
- Trend Seeker buy signal
- Above its 20, 50, and 100-day moving averages
- 16 new highs and up 22.61% in the last month
- Relative Strength Index 73.32%
- Technical support level at $69.05
- Recently traded at $70.74 with a 50-day moving average of $62.32
Fundamental Factors:
- Market Cap $145 billion
- P/E 140.80
- Wall Street projects Revenue will grow 8.40% this year and another 15.30% next year
- Earnings are estimated to increase 107.70% this year, an additional 197.20% next year, and continue to compound at an annual rate of 23.77% for the next five years
Analysts and Investor Sentiment: I don't buy stocks because everyone else is buying but I do realize that if major firms and investors are dumping a stock it's hard to make money swimming against the tide:
- Wall Street analysts issued 31 strong buy, 15 buy, and four hold recommendations this month
- Analysts' price targets are $52 to $90
- Value Line gives the stock an average rating of 3 but with an 18-month price target of $52 for a 25% loss
- CFRAs MarketScope has a four-star buy rating but a 12-month price target of $79 for a 12% gain
- 134,530 investors monitor the stock on Seeking Alpha
Additional disclosure: The Barchart Chart of the Day highlights stocks that are experiencing exceptional current price appreciation. They are not intended to be buy recommendations as these stocks are extremely volatile and speculative. Should you decide to add one of these stocks to your investment portfolio it is highly suggested you follow a predetermined diversification and moving stop loss discipline that is consistent with your personal investment risk tolerance and reevaluate your stop losses at least weekly.
On the date of publication, Jim Van Meerten did not have (either directly or indirectly) positions in any of the securities mentioned in this article. All information and data in this article is solely for informational purposes. For more information please view the Barchart Disclosure Policy here.


