

What a time to be alive. Stocks are at all-time highs, inflation is a distant memory, and the crowd can’t imagine a selloff, states Lucas Downey of Mapsignals.com.
Be careful here. A stock market pullback is underway according to my favorite indicator. Baseball hall-of-famer Yogi Berra had a way with words. He once rattled off the following, it’s like déjà vu all over again. Most of us have had that moment where we experienced the same thing before.
In the movie, “The Matrix”, déjà vu was a signal that something had changed, alerting that the enemy was about to show up. The signal was a glitch to pay attention to. The stock market has its form of déjà vu, through the lens of data. Out of nowhere changes, or glitches, occur under the surface of the market…indicating potential market stress ahead. Fortunately for us, we’ve encountered these situations before, offering us a plan of action. Today we’re going to unpack the current environment, note the changing tides, and make a data-driven case that equities should take a pause.
Stock Market Pullback is Underway
Back in mid-January, I set the stage for how to play a potential market correction. Back then, I began to pay attention once the Big Money Index (BMI) fell out of overbought territory. By following the flow of money, we can gauge when the tide is coming out of equities. As of this morning, our BMI is glitching, indicating there’s potential trouble ahead. While the S&P 500 is notching fresh highs, the small-cap Russell 2000 isn’t participating.
Below is the BMI overlaid against the iShares Russell 2000 ETF (IWM). Note how the BMI has had IWM’s number each time we fell out of the red zone:
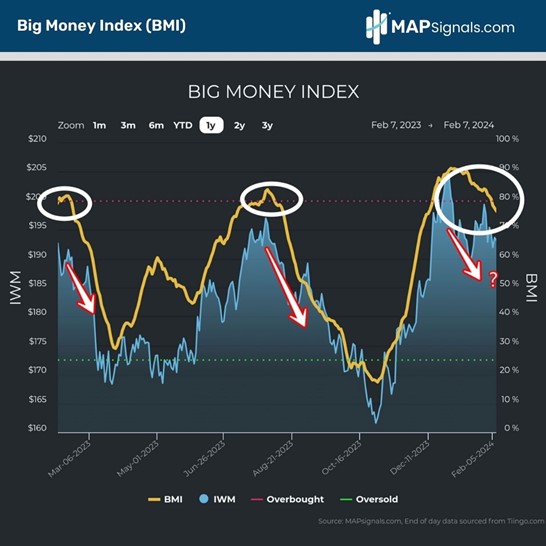
A falling BMI tells us a couple of things:
- First, the breakneck buying seen over the past months is slowing down.
- Second, selling is increasing.
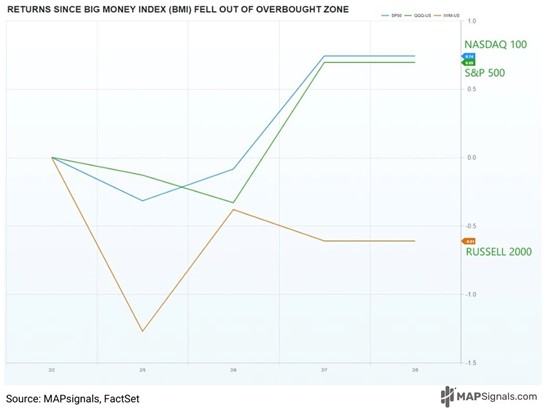
On Friday, the BMI notched its final overbought reading. Here’s how the major indices have performed ever since. The S&P 500 has gained +.69%, the NASDAQ 100 ETF (QQQ) jumped +.74%, and the IWM fell -.61%:
The weakness in the smaller equities is what’s causing the divergence, or glitch, in our data. Like in The Matrix, we’ve encountered this déjà vu before. Rewinding the tape to January 2020 was a prime example of breadth weakening well ahead of a market-wide pullback. I’m not calling for a pandemic-style selloff. I’m only referencing the predictive power of the BMI, which can alert us to unseen shifts taking place.
September 2020 was a case and point. As was in August of 2022.
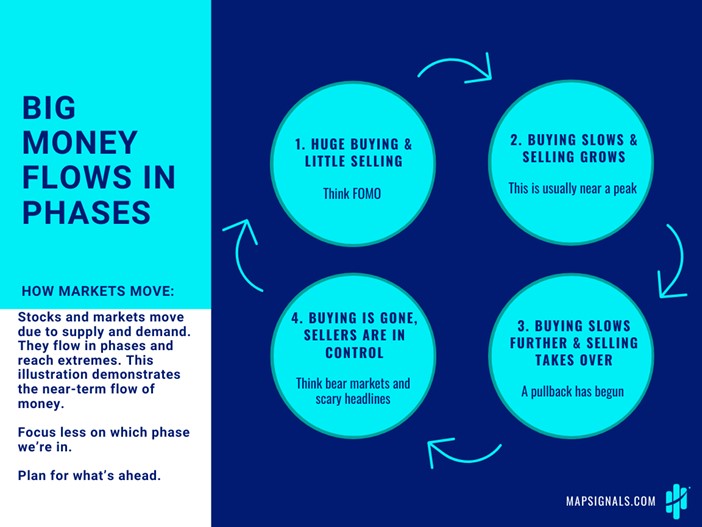
Now’s a great time to revisit the phases of Big Money:
- Huge buying and little selling (December–January)
- Buying slows and selling grows (where we are now)
- Buying slows further, selling takes over (when BMI is free-falling)
- Buyers are gone, sellers are in control (the ultimate buying opportunity)
It’s important to not fixate on where we are currently…rather, focus on what’s ahead. We appear to be entering phase two:
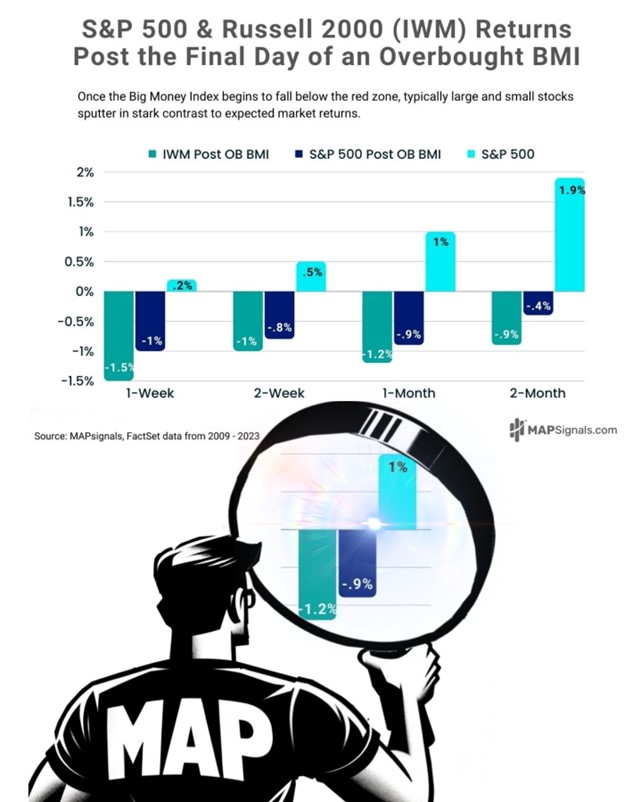
Wow, data is powerful! Now that we know the BMI is falling, small-caps are where the pain’s at, and we could be entering a distribution phase for stocks, let’s now look to history for a guide. Back in January’s insights, I illustrated how the S&P 500 tends to suffer once the BMI falls out of overbought. Today’s study takes it a step further, including the Russell 2000 ETF (IWM).
Turns out, small caps usually suffer more in the weeks and months after we break below the red zone.
Once the Big Money Index falls below 80%:
- A week later IWM falls -1.5% on average.
- A month after, IWM is negative with a 1.2% performance.
- Even out to two months, small-caps struggle
Like Neo in The Matrix, noticing the glitch meant trouble was brewing, our own Marty McMap is feeling the déjà vu all over again:
The evidence suggests a stock market pullback is underway. While no one can ever know exactly how markets will fare in the future, having data as a guiding principle only helps. Is now the time to panic? No, It’s time to have a game plan.
At MAPsignals, we’re discussing these data shifts with our subscribers as the situation unfolds. We’re being patient with adding stocks, as the data glitches, suggesting better entry levels ahead. The best part, many of the stocks that are getting bought right now, keeping the market-cap heavy S&P and NASDAQ afloat, are the names we suggested our subscribers buy when the BMI was last oversold! Yell the loudest when the opportunity is greatest.
Let’s wrap up.
Here’s the Bottom Line: Our data is changing. The Big Money Index (BMI) is falling, indicating a stock market pullback is underway. Thus far, small-caps are feeling the pinch. As we enter a new phase of the market, historical evidence points to equity weakness in the weeks and months ahead. That’s a good setup for patient bulls. Start getting your buy list ready.
Berra also said you can observe a lot by watching…We agree! We’ll be watching our data unfold. And you can, too!
To learn more about Lucas Downey, visit Mapsignals.com.


