

The chart of the day belongs to the audio streaming services company Spotify Technologies (SPOT), states Jim Van Meerten of BarChart.com.
I found the stock by using Barchart's powerful screening functions to find stocks with the highest technical buy signals, highest Weighted Alpha, superior current momentum, and a Trend Seeker buy signal. I then used the Flipchart feature to review the charts for consistent price appreciation. Since the Trend Seeker signaled a buy on 11/ 1 the stock gained 52.78%.
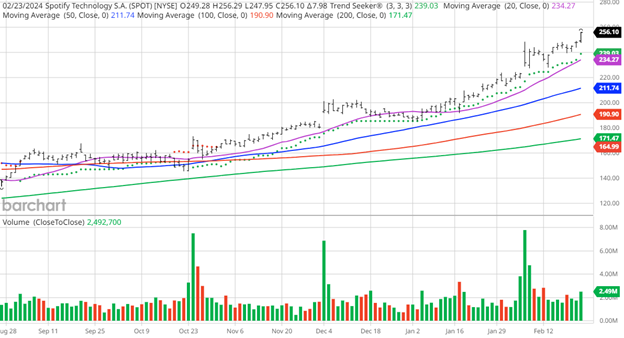
SPOT Price vs Daily Moving Averages
Spotify Technology S.A., together with its subsidiaries, provides audio streaming subscription services worldwide. It operates through two segments, Premium and Ad-Supported. The Premium segment offers unlimited online and offline streaming access to its catalog of music and podcasts without commercial breaks to its subscribers. This segment sells directly to the end users. The Ad-Supported segment provides on-demand online access to its catalog of music and unlimited online access to the catalog of podcasts to its users on their computers, tablets, and compatible mobile devices. The company also offers sales, distribution and marketing, contract research and development, and customer and other support services. Spotify Technology S.A. was incorporated in 2006 and is based in Luxembourg City, Luxembourg.
Barchart's Opinion Trading systems are listed below. Please note that the Barchart Opinion indicators are updated live during the session every 20 minutes and can therefore change during the day as the market fluctuates. The indicator numbers shown below therefore may not match what you see live on the Barchart.com website when you read this report.
Barchart Technical Indicators:
- 100% technical buy signals
- 132.00+ Weighted Alpha
- 115.46% gain in the last year
- Trend Seeker buy signal
- Above its 20, 50, and 100-day moving averages
- Seven new highs and up 23.89% in the last month
- Relative Strength Index 80.28%
- Technical support level at $250.2
- Recently traded at $256.10 with 50-day moving average of $211.74
Fundamental Factors:
- Market Cap 50.49 billion
- Wall Street projects Revenue will grow 17.40% this year and grow another 13.30% next year
- Earnings are estimated to increase 584.30% this year, increase an additional 46.00% next year, and continue to compound at an annual rate of 101.63% for the next five years
Analysts and Investor Sentiment: I don't buy stocks because everyone else is buying but I do realize that if major firms and investors are dumping a stock it's hard to make money swimming against the tide:
- Wall Street analysts issued 17 strong buy, six buy, and 12 hold recommendations this month
- Analysts' price targets are 165 to $332—the consensus price target is $266
- The individual investors following the stock on Motley Fool voted 274 to 22 for the stock to beat the market with the most experienced investors voting 27 to three for the same result
- Value Line rates the stock it's below average rating of four and has a price target of $196 for a 25% loss
- CFRAs MarketScope has a three-star hold rating and a price target of $242
- 72,650 investors monitor the stock on Seeking Alpha
Additional Disclosure: The Barchart Chart of the Day highlights stocks that are experiencing exceptional current price appreciation. They are not intended to be buy recommendations as these stocks are extremely volatile and speculative. Should you decide to add one of these stocks to your investment portfolio it is highly suggested you follow a predetermined diversification and moving stop loss discipline that is consistent with your personal investment risk tolerance and reevaluate your stop losses at least weekly.
On the date of publication, Jim Van Meerten did not have (either directly or indirectly) positions in any of the securities mentioned in this article. All information and data in this article is solely for informational purposes. For more information please view the Barchart Disclosure Policy here.


