

Volatility rose sharply last week, with all eleven S&P SPDR sectors finishing lower, notes Bonnie Gortler of bonniegortler.com.
Technology (XLK) and Consumer Discretionary (XLY) fell the least, while Materials (XLB) and Financials (XLK) were the worst sectors. The SPDR S&P 500 ETF Trust (SPY) was down -1.46%.
S&P SPDR Sector ETFs Performance Summary 4/05/24-4/12/24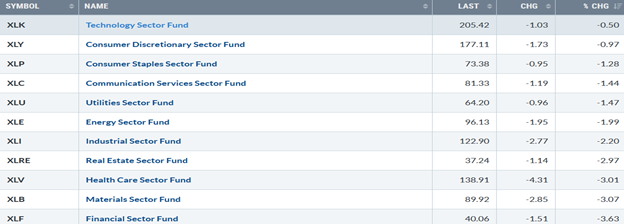
Source: Stockcharts.com
Figure 2: Bonnie’s ETFs Watch List Performance Summary 4/05/24-4/12/24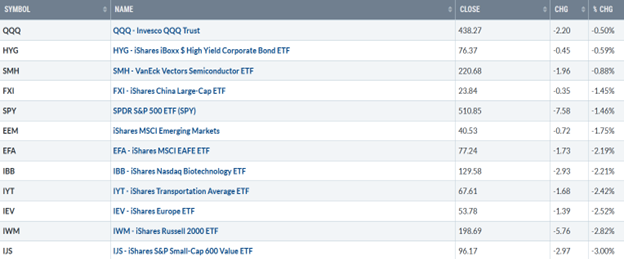
Source: Stockcharts.com
The decline last week was broad-based. Both US and International markets were lower. Small-cap Growth and Value were under selling pressure as yields rose.
Figure 3: UST 10YR Bond Yields Daily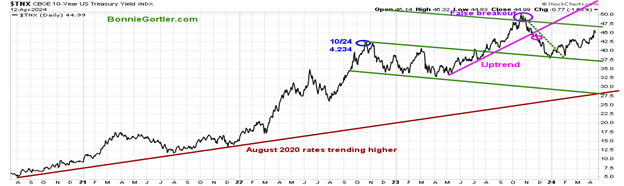
Source: Stockcharts.com
The ten-year US Treasury rose last week, closing at 4.499%, remaining within the channel and below the 2023 high. Yields closing above 4.75% could cause further selling pressure in US Equities.
Figure 4: CBOE Volatility Index VIX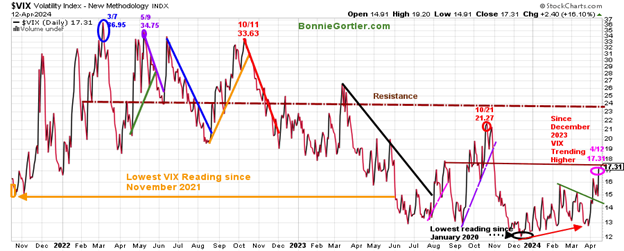
Source: Stockcharts.com
The CBOE Volatility Index (VIX), a measure of fear, traded above 20.00 for most of 2022, with a high at 36.95 on 3/7 (blue circle on the left), which did not get violated in 2023. VIX has been trending higher since December 2023. Last week, VIX increased sharply from 16.03 to 17.31 (8%), and since April first, is up 26.81% and is likely to continue unless VIX closes below 16.00 and then falls below 14.00. Be alert to daily volatility increasing even more if the VIX closes above the October 2023 high of 21.27. The major market averages were all lower last week. The Dow fell -2.37% for the ninth day out of the previous ten days. The S&P 500 fell -1.56%, for its largest weekly loss since October 2023, and the Nasdaq was down -0.45%. The Russell 2000 Index was extremely weak, down -2.92%.
Figure 5: Fear & Greed Index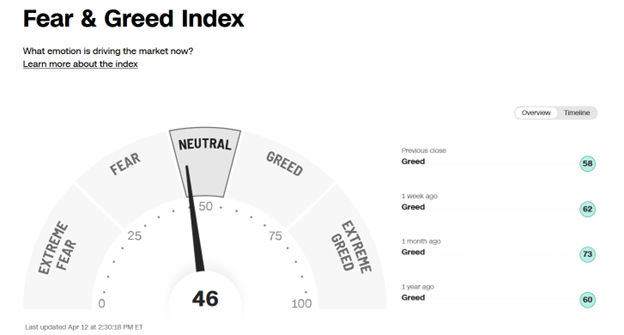
Source: CNN.com
Investor sentiment based on the Fear and Greed Index (a contrarian index) measures the market’s mood. The Fear and Greed Index dropped from 62 last week, showing greed to close at 46, and is now neutral. In the past strong market periods, after readings of Extreme Greed, there has been a retracement towards neutral or fear, which turns out to be a buying opportunity. Time will tell if this will be the case again. Are you interested in learning more about the stock market? Learn how to implement a powerful wealth-building mindset and simple, reliable strategies to help you grow your wealth in my eCourse Wealth Through Investing Made Simple. Learn more here.
Figure 6: Weekly Value Line Arithmetic Average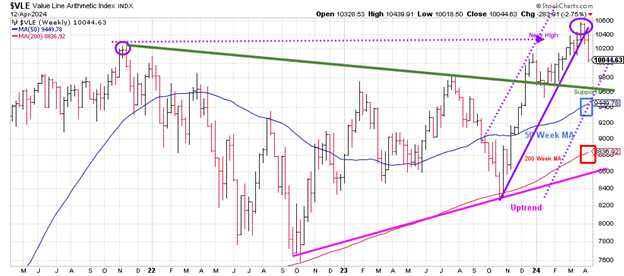
Source: Stockcharts.com
The top chart is the weekly Chart of the Value Line Arithmetic Index ($VLE), which includes approximately 1700 stocks. The uptrend (pink line) since October 2023 broke last week (purple line). The longer-term uptrend from October 2022 (pink line) remains. VLE fell -2.75%, closing near its low for the week. VLE remains above the rising 50-week MA (blue rectangle) and 200-week MA, implying underlying strength. The first support is at 10000, followed by 9600 and 9400. If VLE closes above last week's high of 10439.91, it would be positive for the short term.
Market Breadth Weakens
Weekly market breadth was negative on the New York Stock Exchange Index (NYSE) and for the Nasdaq. The NYSE had 438 advances and 2481 declines, with 225 new highs and 94 new lows. There were 1192 advances and 3436 declines on the Nasdaq, with 236 new highs and 365 new lows.
Figure 7: New York Stock Exchange (NYSE) New Lows 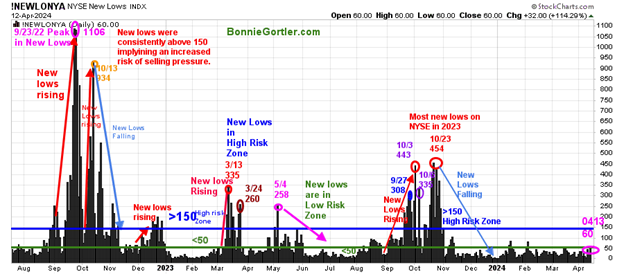
Source: Stockcharts.com
Watching New Lows on the New York Stock Exchange is a simple technical tool that helps increase awareness of the direction of an immediate trend. For most of 2022, new lows warned of a potential sharp pullback, high volatility, and "panic selling," closing above 150. The peak reading of New Lows in 2022 was on 9/23 at 1106, not exceeded in 2023. In 2024, New Lows stayed below 150, a sign of a healthy market.
Last week, New Lows on the NYSE closed at 60 (pink circle), no longer in the lowest risk zone below 25. It would be positive in the short term if New Lows fall below 50 and then below 25 over the next several weeks. On the other hand, an increase above 150 would be a warning sign the recent weakness could accelerate. A rise above 150 would be a warning sign of a deeper market correction. Learn more about the significance of New Lows in my book, Journey to Wealth, published on Amazon. If you would like a preview, get a free chapter here.
Small Caps Stumble as Yields Rise
Figure 8: Daily iShares Russell 2000 (IWM) Price (Top) and 12-26-9 MACD (Middle and Money Flow (Bottom) 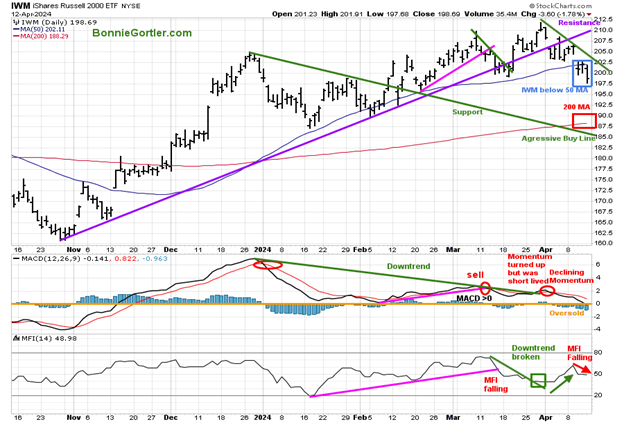
Source: Stockcharts.com
The top Chart is the daily iShares Russell 2000 Index ETF (IWM), the benchmark for small-cap stocks, with a 50-Day Moving Average (MA) (blue rectangle) and 200-Day Moving Average (MA) (red rectangle) that traders watch and use to define trends. IWM peaked in March with a pattern of lower highs. IWM closed below the 50-day MA, which implies underlying weakness. However, IWM closed above the 200-day MA, a key area I would like to see not broken.
Support is at 197.50, 187.50, and 185.00. Resistance is 205.00 and 212.00. MACD (middle chart) remains on a sell, falling below 0. Momentum had turned up at the end of March, breaking the 2024 downtrend, but it was short-lived and turned down. Money flow (lower chart) broke the January uptrend (green line) in early April but has turned down and is negative. It would be positive if Money Flow turned up and exceeded the April high.
Figure 9: Daily Semiconductors (SMH) (Top) and 12-26-9 MACD (Middle) and Money Flow (Bottom)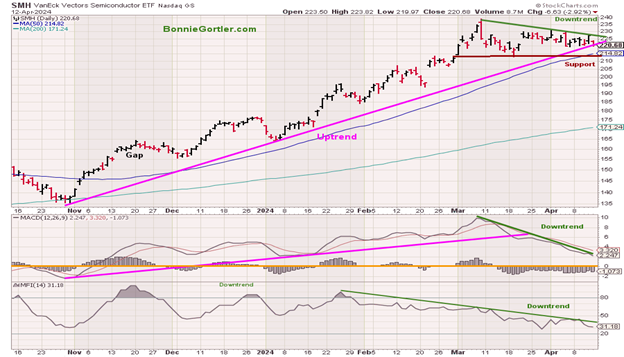
Source: Stockcharts.com
The top chart shows the Daily Semiconductors (SMH) ETF, concentrated mainly in US-based Mega-Cap Semiconductor companies. SMH tends to be a lead indicator for the market when investors are willing to take on increased risk, and the opposite is true when the market is falling. SMH remains in a daily uptrend from November 2023 (pink line). The Semiconductor ETF (SMH) peaked on March 3/8 at 239.14 and has been trending lower, consolidating its gains. The Semiconductor ETF (SMH) fell hard Friday, down -2.92% but only down -0.88% for the week.
Support is at 220.00, 212.00, 205.00, and 200.00. Resistance is at 225.00 and 230.00. MACD (middle chart) remains on a sell above 0, falling in a downtrend. However, it is no longer extremely overbought, getting closer to being oversold, below 0. Money Flow (lower chart) remains in a downtrend from January. It would be short-term bullish if Money Flow turns up and breaks the downtrend. Although the recent weakness, it’s too early to get overly bearish on Semiconductors. The Intermediate Trend Remains Up in Semiconductors.
Figure 10: Weekly Semiconductors (SMH) (Top) and 12-26-9 MACD (Bottom)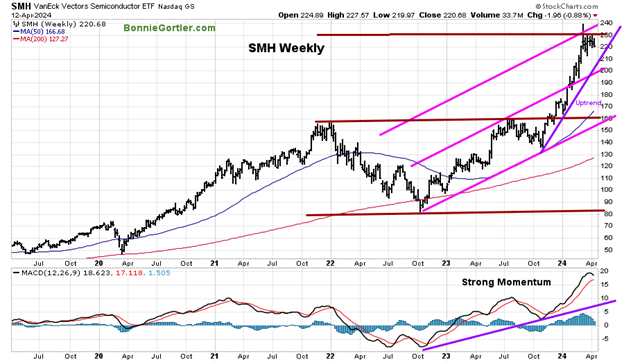
Source: Stockcharts.com
The Semiconductors (SMH) intermediate uptrend from October remains in effect (purple line). MACD (bottom chart) remains on a buy but has turned down after strong momentum and higher highs since the rise from October 2023, implying that the final top has likely not been made. If SMH closes above 230.00 for two days, SMH will give new upside objectives towards 255.00 and 290.00. A weekly close below 200.00 would negate the upside objective.
Figure 11: Daily Invesco QQQ Trust (QQQ) Price (Top) and 12-26-9 MACD (Bottom) 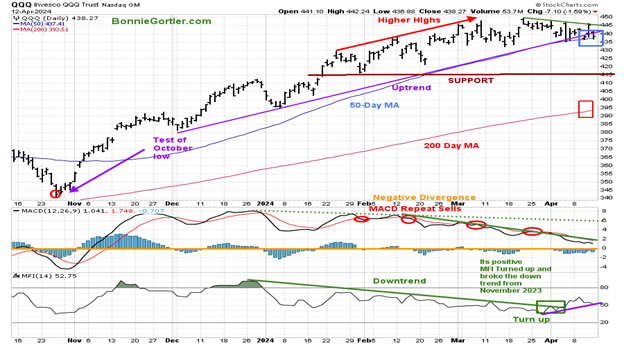
Source: Stockcharts.com
The Chart shows the daily Invesco QQQ, an exchange-traded fund based on the Nasdaq 100 Index. QQQ made a low in October 2023 (red circle), followed by a successful retest of the low in early January 2024 and the start of an uptrend. Nasdaq 100 (QQQ) fell only -0.50% last week, closing slightly below the uptrend from December 2023 (purple line) and support at 440.00. QQQ fell below the 50-day Moving Average (blue rectangle) but closed above. QQQ remains above the 200-day Moving Average (red rectangle).
Support is at 430.00, 416.00, 395.00. Resistance is at 445.00. The bottom chart, MACD (12, 26, 9), remains on a sell, above 0, falling, lowest reading since November 2023. MACD remains in a downtrend (green line) after repeat sell signals. Money flow (lower Chart) had turned up in April but is now falling. A turn-up in Money Flow with a break of the MACD momentum downtrend would be short-term bullish. However, two closes below 430.00 will likely increase selling pressure toward 416.00. On the other hand, two closes above 445.00 will likely hit buy stops and ignite QQQ to move higher.
Figure 12: The S&P 500 Index (SPY) Daily (Top) and 12-26-9 MACD (Bottom)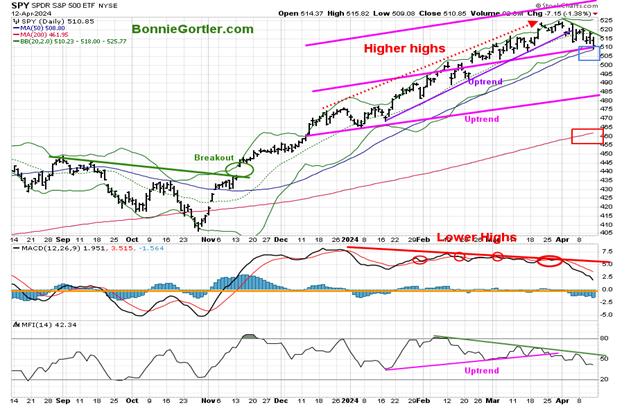
Source: Stockcharts.com
The S&P 500 (SPY) broke the downtrend in November 2023 (green solid line) and has been in a steady uptrend. The SPY accomplished its upside objective of 510.00 and continues to rise. The 2024 daily uptrend was broken (purple line), and the trend is down. The SPY closed at 51.85, down -1.46% for the week, touching the 50-day Moving Average (blue rectangle) but closing above. SPY remains above the 200-day Moving Average (red rectangle). Support is at 502.00, 482.00, and 462.00. Resistance is at 515.00 and 525.00.
MACD (bottom chart) remains on a sell above 0, falling after moving sideways with lower highs and negative divergence. The S&P had its worst day on Friday since January and has been down for the past two weeks. In the short term, it will be favorable if SPY holds support at 502.00 and closes above last week's high of 520.75.
Gold Continues to Shine After Breakout
Figure 13: GLD Weekly and 12-26-9 MACD (Bottom)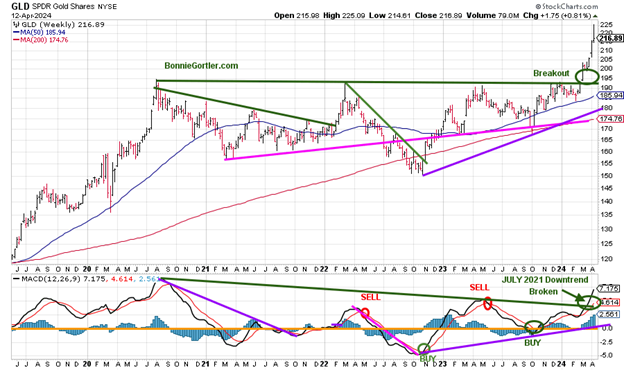
Source: Stockcharts.com
The top chart shows the weekly Gold (GLD) ETF. GLD has risen sharply after the breakout in (green circle) in price and the July 2021 downtrend in MACD (lower chart) broken mentioned in Bonnie’s Market Update 3/8/24. GLD reversed Friday and closed near its lows as investors began to close positions and take profits. Resistance is at 225.00, and support is at 214.00, followed by 211.00.
Summing Up:
The CPI was higher than expected, sparking a decline in equities and rising bond yields. The week ended on a sour note, with stocks falling sharply on Friday, which could linger early this week. Technical indicators continue to show declining momentum and patterns of lower highs since March. Semiconductors, Technology, and Small Cap Value and Growth stocks led the selling pressure. For the bulls to regain control, the major averages need to hold above support and reverse through resistance.
Market volatility is rising, and there are concerns about inflation, rising rates, and increasing hostilities in the Middle East; pay attention to your risk now. Remember to manage your risk, and your wealth will grow. Let’s talk about investing together. You are invited to schedule your Free 30-minute consultation by emailing me at Bonnie@BonnieGortler.com. I would love to schedule a call and connect with you.
Disclaimer: Although the information is made with a sincere effort for accuracy, it is not guaranteed that the information provided is a statement of fact. Nor can we guarantee the results of following any of the recommendations made herein. Readers are encouraged to meet with their own advisors to consider the suitability of investments for their own particular situations and the determination of their own risk levels. Past performance does not guarantee any future results.


