

At least we’ve made SOME progress. When it comes to the SPDR S&P 500 ETF (SPY), that is.
Here’s the MoneyShow Chart of the Day showing where this broad-market ETF stands. On the plus side, we saw a high-volume washout...followed by a massive upside reversal…during the tariff turmoil week. That included the third-biggest “up” day for the S&P 500 on record!
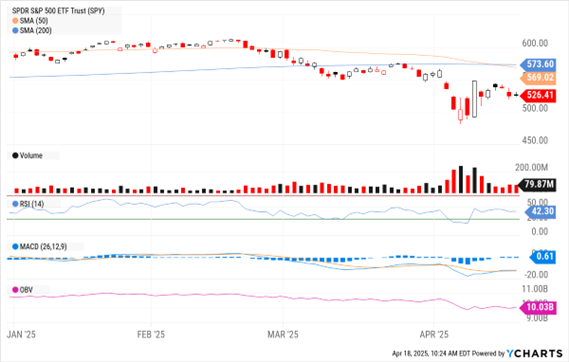
Data by YCharts
We’ve also seen several days of “relative” stability since then, versus a plunge right back to the lows. That’s giving traders time to digest the crazy action, volatility to come in, and markets to reset. Sentiment remains in the dumps, too...which can set the stage for at least a short-term rebound.
On the minus side, we’ve seen a proverbial “death cross” in the moving averages. The 50-day MA has traded down through the 200-day MA. We haven’t yet seen a big follow-through day to the upside. And we’re still facing overhead resistance at the downwardly sloped 50-day PLUS the original downside “gap” from April 1-2.
Putting on my trader’s hat, I’d say we don’t yet have an “all clear” or even a “mostly clear” signal to start playing the upside aggressively. Putting on my investor’s hat, I think dollar-cost averaging into some bargains isn’t the worst idea I’ve heard. Chaos can create opportunity after all.


