

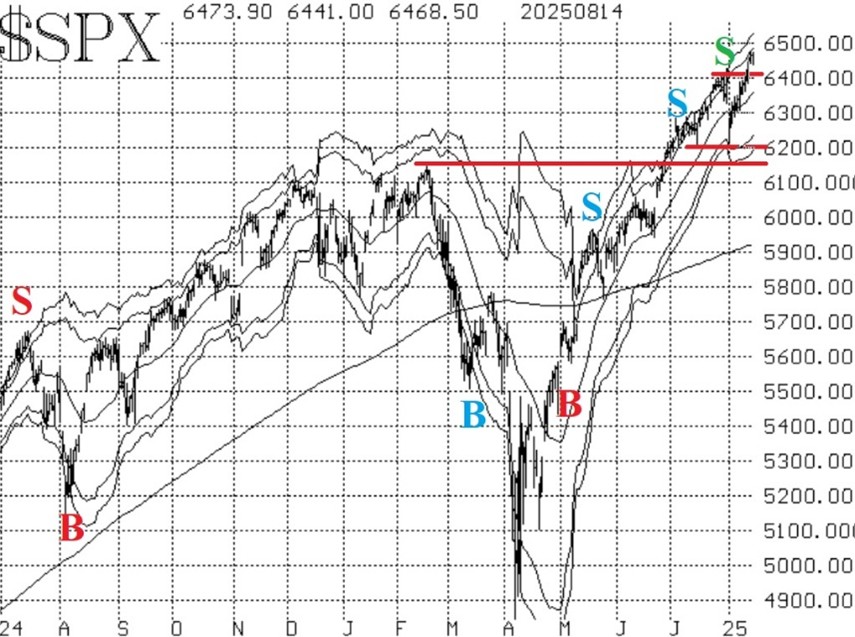
Stocks pushed to new all-time closing and intraday highs this past week on two separate days – Aug. 12 and 13. Any chart making new all-time highs is, by definition, bullish. There is S&P 500 Index (^SPX) support at 6,400...6,200... and 6,150, notes Lawrence McMillan, editor at Option Strategist.
Still, equity-only put-call ratios remain on sell signals for stocks. Their sell signals date back to the beginning of the last correction – in late July. They have continued to rise even while SPX is making new all-time highs.
I attribute this to the fact that investors and traders are buying puts along with stocks in this latest, bullish SPX phase. These sell signals will remain in effect until the ratios roll over and begin to trend downward.
Market breadth has been giving mixed signals. It is positive that breadth was very expansive on Aug. 12 and 13, when SPX was making those new all-time highs. But other than that, breadth has had some difficulties, and the oscillators are on the verge of rolling back over to sell signals.
The remaining indicators have to do with implied volatility, the CBOE Volatility Index (^VIX), or things related to VIX trading instruments, and they are bullish. The chart of VIX is currently giving us two bullish indicators.
In summary, we remain basically bullish in line with the SPX chart. However, we will continue to trade all confirmed signals. Moreover, continue to roll deeply in-the-money options when they appear.


