

You can’t exactly set your clock to it. The timing isn’t 100% perfect. But throughout the gold bull market, we HAVE seen a fairly consistent pattern – and it suggests the metal’s NEXT breakout could be coming soon!
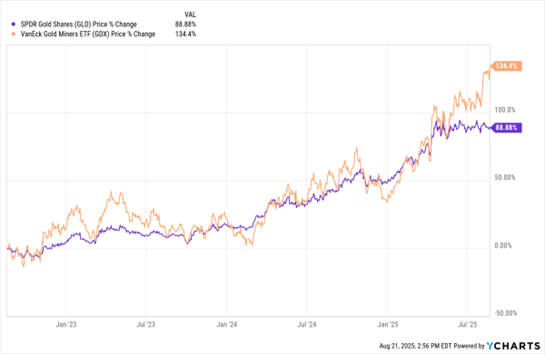
Take a look at the MoneyShow Chart of the Day. It shows the percentage change in the SPDR Gold Shares (GLD) in purple and the VanEck Gold Miners ETF (GDX) in orange. The timeframe is three years.
GLD, GDX (3-Year % Change)
Data by YCharts
Focus first on the past few times gold stagnated after a big upside run. Those periods of sideways chop lasted from around December 2023 to March 2024…May 2024 to August 2024...and October 2024 to January 2025. Each consolidation period began and ended at different times during those months. So, let’s call it three-to-four-months on average.
The current consolidation pattern started in late April. We’re in late August. So, yes, it has been about four months. Could a new breakout be coming...soon? Food for thought!
Now, look at the OTHER interesting thing on this chart – how gold MINERS have kept on climbing even as gold itself has traded largely sideways. That shows you “Big Money” – meaning a lot more “mainstream” fund managers – is buying into this bull market (after fighting it for far too long of course).
Could that be another signal that the underlying metal is ready to rip? No guarantees. But it certainly doesn’t seem bearish to me!


