

There was recently a period of five trading days in which both the CBOE Volatility Index (^VIX) and the S&P 500 Index (^SPX) were up each day. That has never happened before. Is it significant, or might it be? Let’s dig in, says Lawrence McMillan, editor at Option Strategist.
We have been seeing implied volatility trading significantly higher than realized volatility. That is a subject that we’ve addressed in the past, but we are going to update that analysis to incorporate current conditions.
As for the five-day VIX/SPX run, we went back through the entire history of VIX prices. We found that once before there had been a four-day sequence: from 1/29/96 through 2/1/96.
At that time, the market was up sharply after that sequence – rising 2% over the next ten trading days. Eventually, it gave up those gains, but then rallied again later. Of course, a sample size of one means nothing.
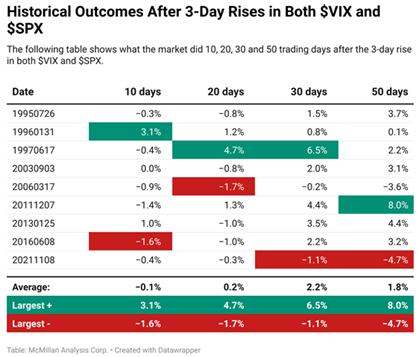
So, we looked at cases where both VIX and SPX had been up for three days together. There are nine of those, not including the most recent one. Even a sample size of nine is questionable, but if a distinct pattern emerged it might be worth considering.
The table above shows what the market did 10, 20, 30 and 50 trading days after the three-day rise in both VIX and SPX. On average, stocks were higher.


