

The government shutdown is over! Well, almost anyway. So, what does that mean for markets? You’ll probably like the answer.
Take a look at the MoneyShow Chart of the Day, courtesy of CNBC. It shows how the S&P 500 Index (^SPX) has performed after all the government shutdowns since 1980. Eight out of ten times the market was higher 100 days later – and nine out of ten times it was higher a year later.
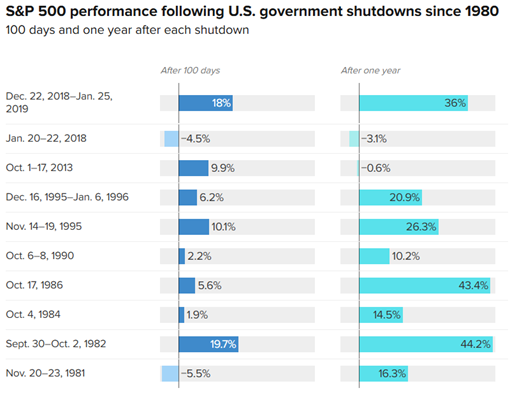
Source: CNBC
Not only that, but in some cases the gains were substantial. Examples include 1982, 1986, and especially 2019 – when the market was up 18% in the intermediate term and 36% a year down the road.
Yes, in all these instances, the economic backdrop, the level of markets, and the geopolitical backdrop were all different. And yes, the world is a different place. I thought the Commodore 64 was pretty awesome in 1982. It pales in comparison to an iPhone in 2025.
But we’re already seeing markets rally on news the shutdown is ending. And we’re already seeing some rotation into other sectors (rather than just tech/AI) during the advance. That’s bullish trading action.
We’re also heading into a time of year where seasonality tends to favor risk-taking, as CFRA Research chief investment strategist Sam Stovall noted recently. That doesn’t guarantee gains. But it certainly doesn’t hurt the bull case.


