

Is Santa ready to fire up the S&P 500 Index (^SPX) sleigh? That would fit with the historical pattern this time of year – and the Federal Reserve’s rate decision gives us a fundamental catalyst, too.
Check out the MoneyShow Chart of the Day here, which comes courtesy of LPL Financial. In their words: “Historically, the index tends to hover around the flatline during the first half of December, with upward momentum building around the 11th trading day.”
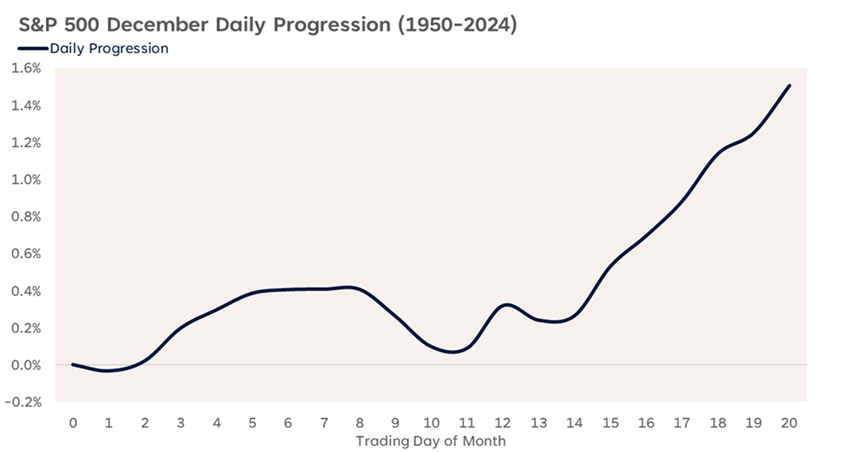
Source: LPL Research
Guess where we are now? Yep…right at “Punch it Rudolph” time.
It doesn’t hurt that the last major potential obstacle to a stock market advance – a monetary policy disappointment – just got pushed aside. Policymakers didn’t vote unanimously in favor of a Fed cut at this week’s meeting. But they delivered a 25-basis point reduction, and that qualifies as “good enough” for the bulls.
Not every stock is participating in this rally (I’m STILL looking at you Oracle Corp. (ORCL)!) Key questions about the lackluster job market, lousy consumer sentiment, relatively sticky inflation, and the K-shaped economy will need answering in 2026.
But in the short term, the stage could be a set for a run into year end. So, keep your eyes out for Santa!


