

This is it – my FINAL MoneyShow Chart of the Day column for 2025 because of the upcoming holidays. So, what will I leave you with? A chart that says: “Things just aren’t that bad.”
Take a look. It’s simple and straightforward. A weekly chart of the S&P 500 Index (^SPX) going back three years, with 20-week, 50-week, and 200-week simple moving averages plus MACD. It shows what should be obvious…we’re still in a long-term BULL market until proven otherwise.
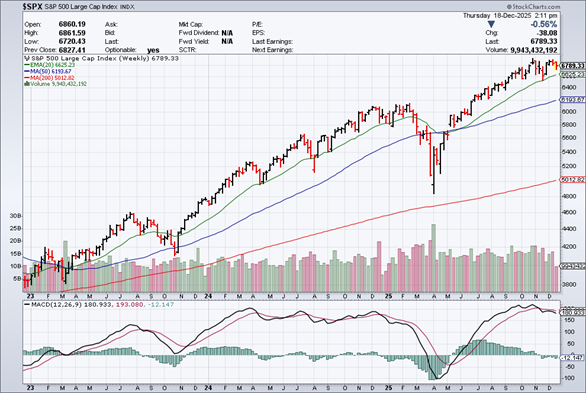
Source: StockCharts
Yes, there’s plenty for investors to worry about in the short term. Weakness in Artificial Intelligence (AI) stocks the last couple of months. A lackluster labor market. An uncertain path for interest rates AFTER the calendar flips. An inability for the market to rally (so far) BEFORE the calendar flips, despite positive seasonality.
But when you step back and look at the BIG picture…it looks a lot different. With the exception of the “Liberation Day” wipeout, 2025 has been a pretty good year. Heck, the last THREE years have been pretty good.
It’s why I’ve repeatedly said to “Be Bold” – on-stage at MoneyShow events, in my market columns, and in conversations with many of you since early 2023. When market conditions change, I’ll sing a different tune. No need to worry about that.
But for now? Enjoy the holidays – and enjoy the bull market!
One last thing: Our MoneyShow 2026 Top Picks Report is dropping the morning of Wednesday, Jan. 7, 2026. This year’s edition includes a whopping 68 picks from 39 top MoneyShow contributors – and you can sign up to get a FREE copy when it's released by clicking here.


