

Is the “Greenland Crisis” over almost before it began? That’s what Wall Street is betting on after President Trump backed down. But small caps are the group that’s really feasting in this whirlwind week.
Take a look at MoneyShow Chart of the Day. It shows the year-to-date performance of the iShares Russell 2000 ETF (IWM), the iShares Micro-Cap ETF (IWC), and the SPDR S&P 500 ETF Trust (SPY). The former two funds are up 8.7% and 9.3% respectively, compared with just 0.5% for the SPY.
Small Caps Keep Ripping, Greenland Crisis or Not
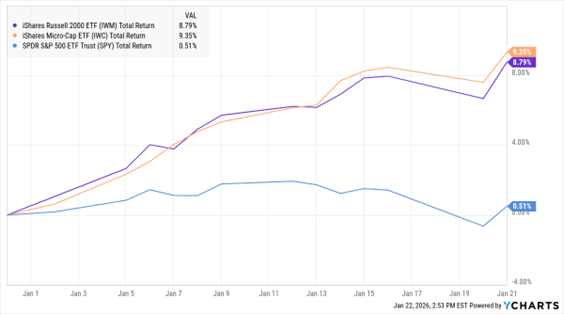
Data by YCharts
So, what’s going on? Let’s look at the details of these ETFs for some answers.
The IWM tracks the (roughly) 2,000 smallest-cap stocks in the Russell 3000 Index. Industrial stocks are the most heavily weighted, accounting for 18.5% of the fund. Healthcare names (17.6%) and financials (17.3%) come next, with technology stocks in fourth place at 14.6%.
For its part, the IWC holds the (roughly) 1,000 smallest-cap stocks in the Russell 3000 Index, plus the next 1,000 smallest stocks in the equity universe. Healthcare is the dominant sector at 28.4% of the ETF, followed by financials at 19.7% and technology at 15.7%.
It’s a whole different ballgame with SPY. Not only are many of its holdings mega-cap stocks, but technology makes up 33.4% of the fund. Financials are second at just 13%, with healthcare next at 9.8% and industrials in fourth place at only 8.7%.
Right now, money is rotating into smaller stocks because they’re perceived to be bigger beneficiaries of easier monetary policy. Plus, sectors like healthcare and industrials are outperforming technology. That’s a double-dose of juice driving ETFs like IWM and IWC. In fact, it’s so powerful that IWM and IWC are now outperforming SPY on a 12-MONTH basis.
New year, new leadership. I like the sound of that. Maybe it’s time for a new approach in your portfolio, too.


