

We have been cautioning about a potential increase in implied volatility for some time. However, the CBOE Volatility Index (^VIX) has essentially refused to move higher. In fact, it’s in a distinct downtrend. Here’s why and what it means, writes Lawrence McMillan, editor of Option Strategist.
The VIX decline has occurred ever since the S&P 500 Index (^SPX) began the latest rally from about the 7,300 level. We are not alone in our opinion, which is perhaps one reason why volatility has remained low: “Everyone” is all set with long VIX calls or long SPX puts. They’re waiting for the volatility explosion, and the majority is often wrong.
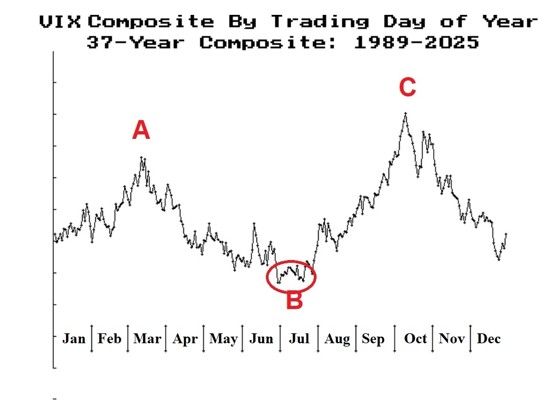
In any case, consider the chart above, which is a repeat of the one we published a couple of weeks ago. It shows that VIX generally makes its yearly low in July, then increases into a volatility apex in October. Of course, not every year follows that pattern, but in general most of them do.
There has clearly been a good deal of reluctance on the part of the investment community to climb on board this northbound SPX train. But it finally looks like put buying is slowing down, and the rally is spreading out to more and more issues (i.e., breadth is improving).