

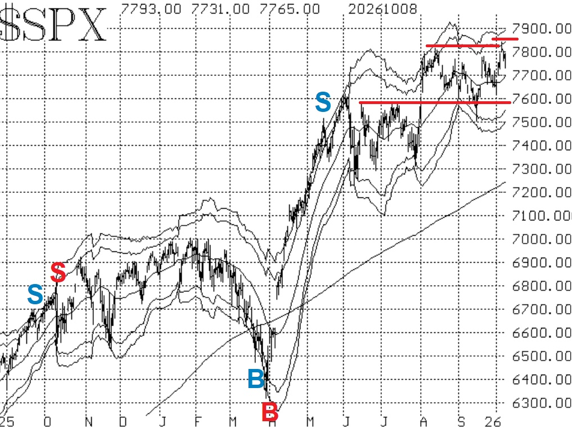
Things seemed so promising last week, when the S&P 500 Index (^SPX) traded at new, all-time intraday and closing highs. But almost immediately after the market closed that day, selling set in. The net result is that there is still resistance around 7,820-7,844, advises Lawrence McMillan, editor of Option Strategist.
While it hasn't been heavy selling so far, it has pushed SPX back down into the previous trading range. Essentially, the upside breakout wasn't a breakout at all, but merely a slight extension of the trading range. There is near-term support at 7,720, then stronger support at 7,580-7,620.
Meanwhile, the market internals have been negative for some time (and still are). Equity-only put-call ratios remain split. The standard ratio remains on a sell signal as it has moved to a new relative high on its chart.
Breadth has tried to improve. There have been several days recently with positive breadth. But that wasn't enough to roll the breadth oscillators over to buy signals. Then the massively negative breadth day of Oct. 7 pretty much put everything back where it was.
In summary, things are pretty much the same. The SPX chart remains neutral to positive, and volatility indicators are positive for stocks. But the market internals are decidedly negative. We will wait for confirmed signals before taking new positions. Meanwhile, continue to roll deeply in-the-money options.