Many traders like to play gaps in individual stocks, but the indices (like the S&P 500 or Russell 2000) offer terrific gap trading opportunities. Scott Andrews tells how to spot opportunities and plan trades around them.
Scott Andrews is my guest, and Scott, I know you are known as the “gap guy.” You trade the gaps. Do you do them index-wise, and what’s your favorite index?
I do prefer trading the gaps in the indices, and that’s because a lot of people don’t realize that the indices, being a basket of stocks, have a higher probability of filling on any given day than say an individual stock.
So, stocks can be impacted by insider trading, stock-specific news, earnings announcements, and so on, but it’s much more difficult for a single piece of news to impact a broad index like the S&P500, so I do prefer the indices. They all have their different nuances, but I prefer the S&P 500.
Why?
It’s still the granddaddy of all the indices; the most diversified. I will say this, though, many people are really enjoying and being profitable trading gaps in the Russell 2000 Index.
That’s right, the small caps.
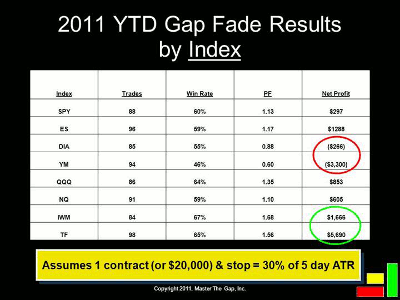
On the ICE exchange. In fact, this chart here shows you how you would have done fading the opening gap for the first six months of 2011 by both the ETF and the futures contract for the S&P 500 at the top, and then the Dow 30, the Nasdaq, and the Russell.
What’s really interesting to me…these assume a $20,000 contract, so this is backtested hypothetical data but assumes a $20,000 position size and a stop equal to 30% of a five-day average true range (ATR).
Now, that’s a mouthful, but I want you to understand what you’re looking at data-wise here. It’s a volatility-adjusted stop, so as the market expands, my stops get bigger. As the market contracts, my stops get smaller because the gaps are sort of expanding and are either bigger or smaller as well.
So, this shows you, and this is interesting because all these indices are extremely correlated, anywhere from a minimum of probably 80%, up to I think the Dow is 99% correlated with S&P 500. What this shows you is applying the exact same rule—fading the opening gap—you would’ve had a wide range of results for the first six months of 2011.
NEXT: How to Manage Risk and Maximize Gap-Trading Profits
|pagebreak|I’ve circled the Diamonds (Trust) (DIA), which is the Dow 30 ETF, and the YM, the Dow mini-futures. They’ve lost money this year fading every opening gap and using a stop equal to 30% of the five-day range.
The S&P has made a little bit of money just above it and the Nasdaq has made a little bit of money as well, but look at the bottom right-hand corner. The Russell ETF and the Russell futures contract have made a lot of money.
On a $20,000 contract, that Russell futures contract has made over $5000, so you would be up 25% in the first six months of the year just simply buying the down gaps, shorting the up gaps, and targeting the prior day’s closing price in the Russell. So it’s been a really good instrument for fading the gap.
How do you determine the stops? You did mention that stops are very important here.
Yeah, what’s interesting about gaps is about 70% of all index gaps will retrace back to the prior day’s close by the end of the day, but that’s too much risk for me.
If you trade all of them, you basically won’t make much money, and the reason is (because) that 30% that doesn’t fill will cost you a lot of money.
They’ll erase all your profits from the 70% that do fill, so I use what I think is a reasonably-sized stop, about 30% of the five-day average true range. I’ve tested a wide range of markets, stock indices, commodities even, and it’s just a good, solid benchmark.
It gives you enough wiggle room to accommodate opening volatility without risking too much relative to the average-sized gap.
Related Reading:


