These three big drug stocks offer attractive yields and relative safety heading into the more challenging summer months, and risk can be well controlled on all three now.
The health care sector had a good first quarter, and the Select Sector SPDR - Health Care (XLV) was up 8.8% and is now very close to the all-time highs from 2007 at $37.89. The health care sector is in a strong seasonal period, and as we head into more difficult summer months, the more defensive nature of this sector further adds to its appeal.
The monthly charts of several of the major drug makers are looking very positive, and the strong volume action suggests they could move sharply higher as the year progresses. All are fairly large holdings in XLV, although I favor the individual stocks over the ETF because they all have higher yields.
Looking at these stocks using the five steps I laid out in a recent Trading Lesson, it should become clear why I like these stocks. Two of the three stocks are already part of the “Charts in Play” portfolio, but I would recommend additional buying based on the recent action.
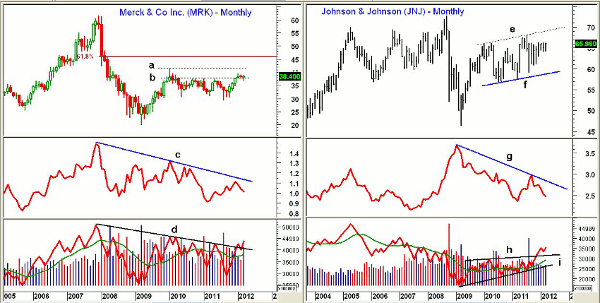
Chart Analysis: Merck & Co. Inc. (MRK) had a good first quarter, as it was up almost 13%, but looking at the monthly chart, the price range over the past three months looks quite narrow. MRK did close the month above resistance at line b.
- The chart has next resistance at $41.66 (line a) with the major 61.8% Fibonacci retracement resistance at $46.15
- In 2007, MRK made a high of $61.62
- The relative performance, or RS analysis, is still declining (line c), while the weekly analysis (not shown) appears to be bottoming
- The on balance-volume (OBV) has broken its four-year downtrend, line d, and volume was strong last month
- Remember that volume is an important part of the five-step stock selection process
- The March low of $36.91 is also the low for the year and is a good guideline for stop placement
- Initial support is now in the $37.50-$38 area
- MRK currently yields 4.4%
The monthly chart of Johnson & Johnson (JNJ) at first does not look as compelling as that of Merck & Co. (MRK), as it shows a broad, $11 trading range, lines e and f, over the past two years.
- What I noticed initially was the very tight range of the past three months, which features a high of $66.32 and a low of $64.02
- There is resistance from 2011 at $68.05, and in 2008, JNJ had a high of $72.76
- Relative performance is still in a downtrend, line g, while the weekly analysis (not shown) has turned up from support
- Monthly OBV looks very strong and has formed higher lows since 2009 (line i) as well as broken through resistance at line h last November
- JNJ closed strong last week and there is first good support in the $65-$65.60 area with more important at $64.02
- JNJ currently yields 3.5%
NEXT: Another High-Yielding Drug Stock to Buy
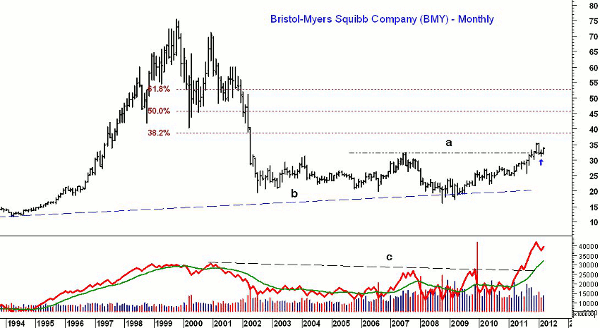
|pagebreak|This long-term monthly chart of Bristol-Myers Squibb (BMY) goes back to 1994. It shows that BMY closed above the 2007 highs at $32.35 last November. It then rallied the next month to $35.44 before pulling back to $31.31 in February (see arrow).
- The monthly chart does suggest a bottom is in place, and it is interesting to note that the uptrend in the $20 area, line b, goes back to the 1980 lows
- Once above $35.44, the major 38.2% retracement resistance from the 1999 high of $75.37 is at $38.80. The 50% resistance level is at $45.70
- Monthly OBV broke through its resistance, line c, in June and led the price breakout by five months
- OBV has surged since the breakout and is well above its rising weighted moving average (WMA)
- Monthly RS analysis is positive and has formed higher highs and higher lows
- There is initial support at $33-$33.30 with further support at $32.50
- BMY currently yields 4.4%
What It Means: The monthly charts of these three drug stocks indicate that they have significant upside potential, and the volume pattern suggests these stocks are being accumulated.
In addition, all have clearly defined monthly support that can be used as stop levels, which is another key component of the “5 Steps for Finding the Next Winning Stock.”
Lastly, all three of these drug stocks have very attractive yields, which this makes them especially appealing for those who are underinvested in the stock market.
Those who bought Johnson & Johnson (JNJ) or Bristol-Myers Squibb (BMY) as per my previous recommendations may now increase those positions by 50% with the new recommendations below.
How to Profit: For Merck & Co. Inc. (MRK), go 50% long at $38.22 and 50% long at $37.84 with a stop at $36.46 (risk of approx. 4.1%). On a move above $40.50, raise the stop to $37.62.
For Johnson & Johnson (JNJ), go 50% long at $65.76 and 50% long at $65.24 with a stop at $63.44 (risk of approx. 3.1%). On a move above $68.10, raise the stop to $64.72.
For Bristol-Myers Squibb (BMY), go 50% long at $33.36 and 50% long at $32.84 with a stop at $31.14 (risk of approx. 5.9%). On a move above $34.90, raise the stop to $32.32.
Portfolio Update
Buyers should already be long Bristol-Myers Squibb (BMY) from $31.10 and now using a stop at $31.14. On a move above $34.90, raise the stop to $32.32.
Buyers should already be long Johnson & Johnson (JNJ) from $62.95 using a stop at $63.44. On a move above $68.10, raise the stop to $64.72.
Buyers should also be long GlaxoSmithKline plc (GSK) from $41.55 using a stop at $43.44.


