As more investors soured on the market this quarter, MoneyShow’s Tom Aspray takes a technical look at key measures of its internal health to see whether there’s any basis for this sentiment or not.
As we head into the last day of the quarter, many are hoping that the second quarter will offer clearer trends in the major averages. The price action in the major averages last week was pretty symbolic as the S&P 500 was down 0.5%, the Dow Industrials were up 0.1%, and the Nasdaq Composite lost 2.8%.
After a stellar market performance in 2013, it has only taken three months for investors to start souring on stocks. Of course, an increase in bearish sentiment is a positive factor when the major trend for stocks is positive.
Individual investors have become less bullish as according to AAII, the bullish % has dropped to 31.16% from over 41% two weeks ago. Most of the bulls moved to the correction camp as the number of bears is up to 28.61% from 26.82% just two weeks ago.
Last night’s 60 Minutes story “Is the US stock market rigged” is likely to scare even more individual investors away from buying stocks. This, I think, is a mistake as the individual investor, who uses limit orders, should see little impact from high-speed trading. Large institutions or short-term traders who trade ahead of or just after important economic reports might see a slight disadvantage.
The effect of this story is likely to give the average investor another reason not to buy stocks. This will likely keep the public ownership of stocks at record low levels until prices are much higher. Just remember what the general press has told the public about the stock market at most of the panic lows since the bull market began in 2009.
As the skepticism over the stock market has risen, another measure of the stock market’s health has improved, let’s take a look.
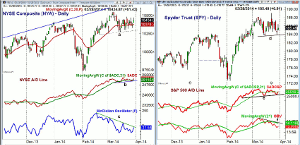
Chart Analysis: The daily chart of the NYSE Composite shows that it has been in a relatively tight range over the past two weeks with a high of 10,481 and a low of 10,272.
- With one day left in the quarter, the new quarterly pivot starting in April should be close to 10,239.
- The NYSE has not had a weekly close below its quarterly pivot since June 2012.
- This makes this coming Friday’s close and reaction to the monthly jobs report quite important.
- There is additional long-term support in the 9900-10,000 area.
- The daily NYSE Advance/Decline made a new high on March 18 and closed Friday back above its WMA.
- The market internals were very strong Friday with 2200 advancing stocks and just 900 declining.
- The weekly NYSE A/D line (not shown) closed the week at a new all-time high.
- The McClellan oscillator hit a low of -115 last week before turning higher.
- A break in the downtrend, line c, would be positive.
- There is minor resistance now at 10,480-500 with the daily starc+ band at 10,591.
- The monthly projected pivot is at 10,697 with the weekly starc+ band at 10,810.
The daily chart of the Spyder Trust (SPY) reveals short-term support now at $184, line d, with the early March low at $182.94.
- The new quarterly pivot is at $182.49 with the monthly projected pivot support at $182.61.
- The minor 50% Fibonacci retracement support from the early February lows is at $180.95.
- The S&P 500 A/D line turned up from support at line e and also closed the week back above its WMA.
- The daily OBV has been forming lower highs since early March but is trying to turn up.
- A move above its WMA and the downtrend, line f, is needed to turn it positive.
- The weekly OBV (not shown) is holding well above its WMA and made a new high two weeks ago.
- Once above $189, the monthly projected pivot resistance for April is at $191.90.
- The weekly starc + band is at $193.47.
NEXT PAGE: 2 Weak Sectors to Watch
|pagebreak|The PowerShares QQQ Trust (QQQ) has dropped 4.7% in the past six days as it hit a low of $86.40.
- The low was below the minor 50% retracement support at $87.28 but above the 61.8% support at $86.32.
- For April, the monthly projected pivot support is at $85.25 with the quarterly pivot at $83.47.
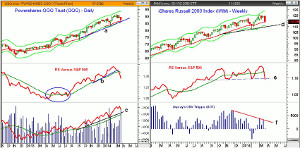
- The weekly chart shows that the 20-week EMA and support at line a are being tested.
- The weekly and daily starc- bands are in the $84.90 to $85.37 area.
- The weekly relative performance broke its uptrend on March 14.
- The RS line has now dropped further below its WMA, which is flattening out.
- The weekly OBV made a new high just a week ago.
- Despite the high volume last week, the OBV is still well above its WMA.
- The daily OBV (not shown) is below its WMA and shows no signs yet of bottoming.
- There is initial resistance in the $89-$90 area.
The iShares Russell 2000 Index (IWM) was also hit hard last week, down 3.4%, as it closed just above the next quarter’s pivot at $113.85 and the 20-week EMA at $113.86.
- The minor 50% support at $113.94 was just slightly violated with last week’s low of $113.69.
- The 61.8% support stands at $112.35 with April’s monthly projected support at $111.90.
- The weekly starc- band is at $110.50 with the trend line support (line d) at $109.47.
- The weekly relative performance has now slightly violated the support at line e but did confirm the recent highs.
- The daily RS line is still dropping sharply and shows no signs yet of bottoming.
- The weekly Aspray’s OBV Trigger (AOT) is holding just barely above the zero line.
- The AOT has diverged from prices since last November.
- There is initial resistance now at $116.08 with stronger at $117.50-$118.
What It Means: As the market has moved sideways, the market internals have improved suggesting that while the Nasdaq and small caps still look weak, the NYSE Composite looks ready to move higher. If the S&P 500 and Dow Industrials are able to break out to the upside, it is likely to catch many by surprise. That is why it is important to have an investing plan in place so that the Fed action or other news doesn’t derail your portfolio.
The Dow Industrials A/D line has also shown some improvement, so maybe it will finally be time for the large-cap stocks to shine.
How to Profit: For the Spyder Trust (SPY), go 50% long at $186.08 and 50% at $183.96, with a stop at $179.77 (risk of approx. 2.8%).


