
With the Dow Industrials still lagging the S&P 500 for the year, MoneyShow’s Tom Aspray analyzes some of the most oversold Dow stocks to identify some new opportunities among these high-yield, large-cap stocks.
April was a very split month for the stock market as the iShares Russell 2000 Index (IWM) dropped 3.7%, but the Spyder Trust (SPY) was up 0.7%. The PowerShares QQQ Trust (QQQ) had a nice rebound from the April 15 low to close the month down just 0.3%, having been down 5% at one point.
The SPDR Dow Industrials (DIA) beat the SPY for a change as it was up 0.8% for the month. It is still lagging for the year as DIA is up just 0.17% for the year versus a 2.28% gain for the SPY. The NYSE Composite did slightly better than the Dow Industrials for the month and has just about matched SPY on a YTD basis.
More importantly, the weekly NYSE Advance/Decline broke out to the upside in early January and has made a series of higher highs since then. It has accelerated to the upside over the past few weeks, which is a positive sign for the stock market in May.
At the end of the month, I run a number of scans based on the monthly data, one of which is a scan of all stocks in the Dow Industrials to see how they closed the month relative to their starc bands. When a market (stock, index, ETF) is close to its starc+ band, it is considered to be a high-risk buy as the bands will contain around 92% of the price activity.
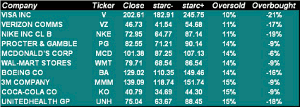
Click to Enlarge
Dow stocks that are closest to their starc- bands are considered to be in a low-risk buy zone but one then needs to look at the monthly charts and technical studies to determine the major trend. If the major trend is positive, then the weekly and daily charts are reviewed in order to develop a strategy.
At the top of this month’s oversold level is Visa Inc. (V), which is just 10% above its monthly starc- band. This is quite a change from January as the stock had a high of $235.50, which was well above its monthly starc+ band at $222.36. V closed last week down over 13% from the January high. Let’s take a look at its monthly chart, as well as three others, one of which was previously recommended.
Click to Enlarge
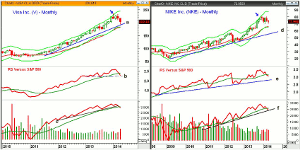
Chart Analysis: The monthly chart of Visa Inc. (V) shows that it came quite close to its monthly uptrend, line a, in April. This support is at $193.90 in May.
- The rising 20-month EMA is at $182.78, which is quite close to its starc- band.
- The relative performance turned positive in July 2011 but has just dropped below its WMA.
- The RS line has next good support at line b.
- The monthly OBV dropped below its trend line support, line c, in March.
- It just dropped below its WMA in April as volume was the heaviest since May 2012.
- The weekly studies (not shown) are both well below their WMAs and negative.
- The close last Friday was just below the monthly pivot at $205.20.
- There is further resistance at $211.54 with the quarterly pivot at $220.49.
Nike Inc. (NKE) tested its monthly starc+ band from September through November of 2013 before it stalled for a few months. The all-time high at $80.09 was made in the first week of March.
- With last Friday’s close at $72.99, NKE is down 8.8% from this high.
- In April, the quarterly pivot at $74.53 was tested twice but it has not been able to close above it on a weekly basis.
- The relative performance made a convincing new high at the end of 2013.
- The RS line has dropped below its WMA but is still well above long-term support at line e.
- The monthly OBV is testing its monthly support at line f and is below its WMA.
- Both the weekly OBV and RS lines (not shown) are below their declining WMAs.
- There is next support in the $71.10 to $70.60 area, with the monthly projected support at $68.97.
- The 20-month EMA is just above $66 with the starc- band at $64.77.
NEXT PAGE: 2 More Oversold Dow Stocks
|pagebreak|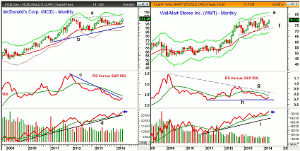
Click to Enlarge
McDonald’s Corp. (MCD) was recommended in April’s monthly review as I continue to think that the sideways pattern since 2011 (line a and b) is a flag or continuation pattern that will eventually be resolved to the upside.
- The 20-month EMA has been tested over the past four months and is now at $95.46.
- The monthly projected pivot and the upper boundary of the flag formation (line a) are at $105.15.
- The downtrend in the relative performance from the December 2011 high, line c, was broken in April.
- The RS line is still below its declining WMA.
- The weekly RS line has broken its downtrend and is well above its WMA.
- The monthly OBV closed at a new high in April as it is leading prices higher.
- This increases the probabilities on an upside breakout.
- The weekly OBV broke its year-long downtrend last month, so the multiple time frame OBV analysis is positive.
- The monthly pivot is at $99.87 with the rising 20-week EMA at $97.68.
Wal-Mart Stores (WMT) has frequently been in the news for its new products like money transfers and car insurance. It reports earnings on May 15.
- The monthly chart shows an upward sloping trading channel (lines e and f).
- The series of slightly higher lows is a positive sign as the 20-month EMA at $73.94 has been tested twice since October.
- The quarterly projected pivot resistance at $79.66 was tested last week with further resistance at $84.51 (line e).
- The relative performance is trying to bottom, line h.
- The RS line needs to move above its WMA and the downtrend, line g, to signal it is a market leader.
- The monthly OBV made a new high in April (see arrow) suggesting that WMT is being accumulated.
- The monthly pivot is at $78.66 with the monthly projected pivot support at $77.34.
What It Means: The analysis of Visa Inc. (V) suggests it can still go lower as it needs a close above $211.60 to complete a bottom.
The inability of Nike Inc. (NKE) to close above its quarterly pivot suggests a cautious approach, and it would look more attractive in the $68-$69 area.
Our initial buying zone in McDonald’s Corp. (MCD) was hit, and I would look to add on a pullback.
As for Wal-Mart Stores (WMT), a pullback is required to reach a buy level where the risk can be well controlled.
The Dow stocks were also discussed in a recent trading lesson, 4 Dow Stocks Under Accumulation.
How to Profit: For Wal-Mart Stores (WMT), go 50% long at $77.66 and 50% long at $76.24, with a stop at $73.39 (risk of approx. 4.6%).
Portfolio Update: For McDonald's Corp (MCD), would be 50% long at $96.64. Add another 50% at $98.94 or better. Use a stop at $95.74 on both positions.


