
The continuing decline in crude oil prices and in the energy stocks has many wondering how low they can go, so MoneyShow's Tom Aspray looks at the weekly technical studies to see if there's any hope for the holders of energy stocks.
The IMF's lower forecast for the global economy hit the market hard from the opening on Tuesday. Once again the selling in the EuroZone put pressure on the US market before the opening. The Dax Index is down almost 1.0% in early trading Wednesday but is still over 1% above the August lows.
The market internals were solidly negative Tuesday with only 723 stocks up and 2435 declining. The McClellan oscillator has declined to -138 but is still well above the September 25 low of -244. The Dow Transports were hit hard as it was down 2.5% on the day with the Philadelphia Gold/Silver index even worse as it lost 3.6%.
The Transports are economically sensitive-which can help explain the decline-but this sector should also benefit from the recent plunge in energy prices that should help the bottom line of the transportation stocks.
The continuing decline in crude oil prices and in the energy stocks has many wondering how low they can really go. Can the seasonal trend for crude oil give holders of the energy stocks any hope? How about the weekly technical studies? Let's take a look.
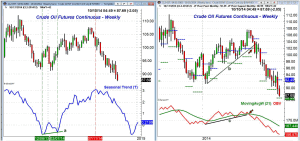
Click to Enlarge
Chart Analysis: The continuous chart of the continuous crude oil contract shows the steady plunge in prices from the June highs.
- Analyzing the seasonal trend in crude oil prices, using data back to 1984, shows that prices historically top on July 11.
- The chart shows that, typically, prices decline into an initial low on December 6.
- Therefore, prices could potentially decline for another two months.
- Prices typically rally into early January before making a final low on February 7.
- The seasonal bottom is indicated by support at line a.
- On the chart, one can see that the low last year came in early January ahead of the normal typical pattern.
The weekly chart of the crude oil futures shows that the pivot at $95.71 was tested in early September before prices pushed to the downside.
- Prices stayed below the quarterly pivot from July though the end of September.
- For the 4th quarter, the pivot stands at $95.89.
- The October monthly projected pivot support is at $86.99.
- The quarterly projected pivot support is at $80.21.
- Crude oil broke its weekly uptrend, line b, the second week of July.
- The weekly OBV broke its uptrend (line c) four weeks earlier.
- The OBV has been leading prices lower and shows no signs yet of bottoming.
- The daily OBV (not shown) is still holding above the late August lows.
NEXT PAGE: 2 Energy ETFs to Watch
|pagebreak|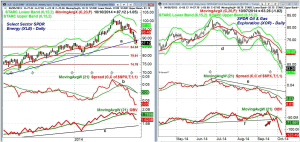
The Sector Select SPDR Energy (XLE) has broken the weekly uptrend, line a, going back to 2013.
- The weekly starc- band was tested last week and is at $86.19 this week.
- The major 38.2% Fibonacci retracement support from the June 2012 lows is at $84.84.
- The more important 50% support level is at $79.81.
- The weekly relative performance peaked with prices in June.
- The RS line dropped below its WMA in the middle of August and shows a well established downtrend.
- The OBV did not turn solidly negative until the latter part of September.
- It is well below its declining WMA but is well above support at line c.
- There is initial resistance in the $90.50-$91.90 area.
- The monthly pivot is at $92.95 with the declining 20-week EMA at $93.48.
The daily chart of the SPDR Oil & Gas Exploration ETF (XOP) shows that the plunge accelerated over the past week.
- The major support, line d, was broken in the middle of September.
- On Tuesday, XOP closed below the weekly starc- band at $63.15.
- The daily starc- band is at $61.74 with the monthly projected pivot support at $61.48.
- The width of the trading range has downside targets in the $61 area.
- The daily RS line shows a well established downtrend, line e.
- The RS line plunged last week, making sharply lower lows.
- The daily on-balance volume (OBV) violated support going back to May, line f, in September.
- It is now well below its WMA and is, therefore, getting oversold.
- The weekly OBV (not shown) is also clearly negative.
- There is initial resistance in the $66.27-$67 area with the declining 20-day EMA at $69.60.
What it Means: The continued plunge in crude oil prices is clearly impacting the markets as it is being fueled by the strong dollar and global economic concerns.
Some value analysts are pointing to the historically low valuations of many of the major oil companies that are likely to eventually lead to some buying at these low levels. Some of the oil stocks in the Dow Industrials are getting even more oversold than they were at the end of September (The 10 Most Oversold Dow Stocks).
It will take some time before the daily technical studies could turn positive.
How to Profit: No new recommendation.


