
The slight pullback in the major averages Friday suggests the rally may have stalled for the short-term, so MoneyShow’s Tom Aspray takes a technical look at several key stocks in the sector to see if any look attractive on a pullback to support.
The weekly technical studies improved last week as the new high in the weekly NYSE A/D line continues to support a bullish outlook for the stock market. It shows no signs of a serious correction. The slight pullback last Friday in the major averages suggests that the rally may have stalled for the short-term. The S&P futures formed a doji Friday suggesting indecision and the futures are currently trading below Friday’s low.
The weekly volume analysis has improved but needs a strong close this week to move firmly back into the buy mode. The Spyder Trust (SPY) and the small-cap iShares Russell 2000 (IWM) were both able to breakout above their previous swing highs. The small-caps led as the IWM gained 3.5% last week versus a 3% gain in the SPY.
A review of the key sectors as well as the weekly/monthly OBV and RS scan identified several stocks that look positive on all time frames. One of last month’s favorite health care picks, Hospira Inc. (HSP), also had a bullish and weekly technical outlook. It received a buyout offer from Pfizer Inc. (PFE) last week and was up over 35% on Friday.
The Sector Select Consumer Discretionary (XLY) was up 4.2% last week and it has reasserted itself as a market leader as shown by both the weekly and daily technical studies. Several stocks in this sector also showed up in my weekly scans and there is one that looks particularly attractive on a pullback to support.
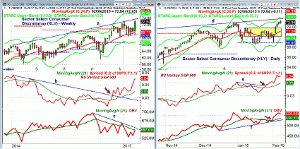
Click to Enlarge
Chart Analysis: The Sector Select Consumer Discretionary (XLY) has successfully tested its quarterly pivot at $68.85 for four weeks before last week’s surge.
- The close was well above the prior week’s highs and the close was just below the chart resistance at line a.
- The weekly starc+ band is at $75.45 with the quarterly projected pivot resistance at $80.39.
- The weekly RS line moved through its resistance, line b, at the end of November.
- It has turned sharply higher in the past few weeks and the monthly RS analysis is also clearly positive.
- The weekly OBV is still diverging from prices, line c, but is now testing its WMA.
- The monthly OBV analysis is clearly bullish.
- There is initial weekly support in the $71.80-$72 area.
The daily chart of the Sector Select Consumer Discretionary (XLY) shows that the ranges narrowed late last week.
- XLY approached its daily starc+ band and the chart resistance (line d) in the $73.95-$74.01 area last week.
- A breakout above this resistance has targets in the $78-$80 area.
- As XLY was dropping to its 2015 low at $69.06, the daily RS line had already broken its downtrend, line e.
- It has continued to rally since late January and has moved to significant new highs.
- The daily OBV turned higher in late January and is very close to the December high.
- On the daily chart, I have highlighted an initial buy area that includes the rising 20-day EMA at $71.20.
- XLY closed 2.4% above its 20-day EMA on Friday.
- The monthly pivot is at $70.38 with further support in the $70 area.
- The daily starc- band is at $69.76.
Next: Another Stock to Watch
|pagebreak|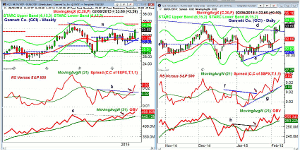
Click to Enlarge
Gannet Co. Inc. (GCI) is a $7.59 billion media and marketing company that has a yield of 2.38%. GCI was up 10.69% in 2014 as it lagged the S&P 500.
- The weekly chart shows that the close last week was above the downtrend, line a, at $32.90.
- The weekly starc+ band is at $34.84 with the quarterly resistance at $35.16.
- The weekly relative performance broke through resistance, line b, at the end of January.
- The RS line is rising more sharply now with the monthly RS analysis also positive.
- The weekly OBV broke out four weeks ago as it overcame the resistance at line c.
- The monthly OBV (not shown) has been above its WMA since early 2012.
- GCI has been moving above and below the quarterly pivot at $30.47 until last week’s strong close.
- The 20-week EMA is at $31.29 with the starc- band at $28.01.
The daily chart of Gannet Co. Inc. (GCI) more clearly shows the recent trading range, lines d and e.
- The range has upside targets in the $36-$38 area.
- The daily RS completed its bottom formation in the middle of January by moving above the resistance at line f.
- The relative performance shows a strong uptrend, line g, as it tested its WMA at the end of January.
- The daily OBV shows a similar bottom formation as it moved above its resistance, line h, on January 21.
- The OBV turned up from its rising WMA last week.
- There is short-term support now at $32-$32.60, which includes the 20-day EMA.
- The daily uptrend, line e, is at $31, which is just above the quarterly pivot at $30.47.
What it Means: In last week’s strong rally, several sectors that had closed on Friday January 30 below their quarterly pivots reversed last week and closed back above these key levels. I will be focusing on some of the other sectors this week.
The Retail Sales on Thursday as well as Friday’s Consumer Sentiment should shed light on the consumer and I think these two picks should do well in the coming months.
How to Profit: For the Sector Select Consumer Discretionary (XLY) go 50% long at $71.47 or better and 50% at $70.74 with a stop at $68.29 (risk of approx. 3.9%).
For the Gannet Co. Inc. (GCI) go 50% long at $32.77 or better and 50% at $31.14 with a stop at $30.29 (risk of approx. 5.2%).


