It’s a good idea to look at some of the methods that traders can use to reduce risk when establishing a position, so Richard Cox, of Market Bulls, highlights one strategy he thinks is one of the best ways to manage risk; scaling.
Over the last decade, the active use of computers in financial markets has grown exponentially. In many ways, this has changed the way people invest their money and view the trend activity that is currently visible in all of the major asset classes. But perhaps most important is the fact that the use of computer algorithms and price charts in making trading decisions has led to massive increases in the use of technical analysis strategies.
The central benefit of technical analysis is that it allows traders to identify specific price levels that can be used for position entries and exits in ways that are more specific than what can be seen in fundamental analysis strategies. That is not to say that these two approaches cannot be used in conjunction with one another. Indeed, they can. But there are certain benefits that come with each approach, and these benefits should be understood before placing any real-money trades that are based on either outlook.
So, if we understand that a benefit of technical analysis is that it allows us to identify specific exit and entry points, it is a good idea to look at some of the methods traders can use to reduce risk when establishing a position. One of the best methods for accomplishing this is scaling, which is where traders divide their position sizes into smaller portions and enter into the market at more than one price point.
Typically, this is done as the market is working against the original position. For example, let’s assume that a trader has a bullish outlook for XYZ stock at $55 per share. A conservative trader might choose to divide the total position size into thirds and set a separate buy order at $55, $50, and $45 per share. The main benefit of scaling is that it allows traders to reduce the average entry price for the position. Furthermore, it offers traders a more proactive approach that can be taken when markets start to move on the wrong direction (i.e. moving against your trade).
Identifying Price Levels
In the example above, the entry points for our bullish position were relatively arbitrary. Practitioners of technical analysis will need to develop trading ideas that are much more specific than that, as this is the only way to turn market probabilities back into your favor. It can be said that there are many technical analysis strategies as there are technical analysis traders, so there is a variety of different ways of accomplishing this. But one method that can be easily visualized is through the use of Fibonacci retracements. For those unfamiliar with the term, Fibonacci retracements essentially plot points of potential support and resistance within the context of a much larger price move.
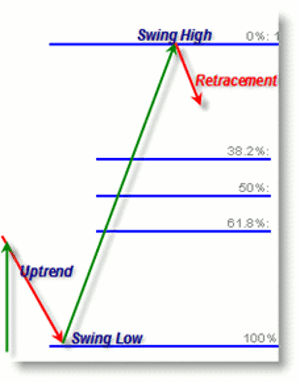
These points are identified using certain percentage levels, the most common of which are 38.2%, 50%, 61.8%. These price levels can be visualized using the graphic below:

Source: Teach Me Trading
Click to Enlarge
In this example, we can see how Fibonacci retracements work when prices are in an uptrend. Here, the impulse price move is positive. The rally then completes and prices begin to retrace. Since the dominant move is positive, we still expect the momentum to be bullish and for prices to find support at the 38.2%, 50%, and 61.8% retracements. In a downtrend, this structure would be reversed and the Fib retracement levels would be expected to act as resistance.
Scaling Positions
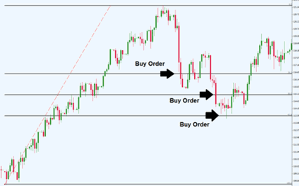
So, how can we use this information to scale into positions? Assuming again that we have a positive stance on an asset, we can take our maximum position size, divide it by three, and then set three different buy orders in the region of each major Fib retracement. Consider the real-time chart below using a stock price chart in Apple, Inc. (AAPL):
Using this approach, we could have placed three equal buy orders at 116.65, 115.10, and 113.60. This approach would have worked well because prices quickly dropped past the first buy order. If this had been our only buy order, our average position would have been 116.65. But since we had two buy orders at lower prices, our average position was 115.10. Prices quickly rose after finding support at the 61.8% Fib retracement and the trade was soon in-the-money.
With all of this in mind, we can see that scaling into positions can give traders added protection if markets start to turn against a specific trade. There are many methods that can be used to scale into your market trades but this is an excellent approach to keep in mind in order to improve your average position price and protect yourself against unexpected market volatility.
By Richard Cox, Technical Analyst at Market Bulls


