Since US crude oil supplies are at the highest in 80 years, Matt McKinney, of Zaner Group, takes a technical look at the charts to offer a few options plays, like buying puts or bear put spreads with a call for a hedge or selling deep out-of-the-money calls to collect premium.
As everyone and their neighbor races for their market share of crude oil, the glut could grow.
Fundamentally, crude oil supplies here in the US are at the highest in 80 years. The highest on record, or really, the highest ever, in my opinion. That's right with the Energy Information Agency (EIA) reporting on Wednesday this past week that supplies increased 8.9 million barrels from the previous week, the glut settled at a whopping 406.7 million barrels. So, on the supply side of things, could it be more bearish?
This is primarily to the best news I have heard in years. Massive increases in production here in the US and Canada. This means our dependence on oil from the Middle East could be dwindling. All due to a vertical hydraulic fracturing drilling method sometimes called "Fracking." This is a technique they are using that involves pressurized water, sand, and chemicals to extract shale oil. It's working like a charm and the proof is in the record supplies.
The Subtle Trap of Trading:
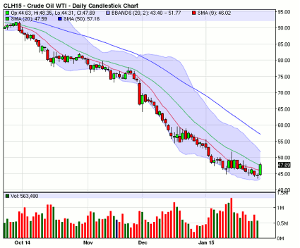
Technically, I have added my favorite technical indicators to the crude chart below. They are the 9 (red line), 20 (green line), and the 50 (blue line) period simple moving averages or SMAs. I have also added Bollinger Bands or BBs (the light blue shaded area) and Candlesticks (the red and green bars). On the daily chart below, each bar or Candlestick represents one day of trading. These few technical indicators tell me a half dozen or so different characteristics about the market at a quick glance.
Also, from a technical standpoint, this is in what I have coined a “Super Trend” down on the chart below. In order to achieve this what we need to have happen first is a cross of the 9 period SMA (red line) down and under the 20 period SMA (green line) as both indicators point lower on a fairly sharp angle while the market itself trades below the 9. Now we have the 9 period SMA as our first area of resistance, then the 20, and on the daily chart the 50.
On the daily chart below, I also want to point out that what I like to pay attention to on the Bollinger Bands is not the light blue shaded area itself, but where the light blue area starts at the bottom and then where it ends at the top. So I have five out of five of my indicators pointing down and they are the 50-day, the 20-day, the 9-day, the bottom line of the BBs, and the top line of the BBs. That is extremely bearish to me, especially when the market is trading not only below the 9-day SMA (red line), but it closed right up on the resistance of it Friday of last week (1-30-15). This could also indicate a very healthy bear market especially if we go on to make new lows from here. If not, then keep an eye out for the next area of resistance, the 20-day SMA (green line).
March Daily Crude Oil Chart
Super Trend Simple Moving Average Report:
Option Play:
Some good plays I think could be to buy puts or bear put spreads with a call for a hedge or "insurance" in case the trend changes to up dramatically. I would recommend this in a 3 to 1 ratio as always. Puts or bear put spreads have a limited risk and unlimited profit potential to zero for the price of the underlying future.
Another potential play could be to sell deep out-of-the-money calls to collect premium. However, this strategy requires a well-funded account and high risk tolerance, in my opinion.
It is also important to note that I am not married to a market, but to trends. So I make recommendations with options on futures and commodities like the grains, metals, currencies, softs, financials, and more.
By Matt McKinney of Zaner Group


