Just like the Energizer bunny, the stock market keeps on going, and the staff at BespokeInvest.com details how it measures up to other bull markets in history.
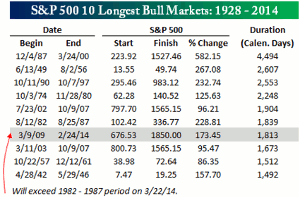
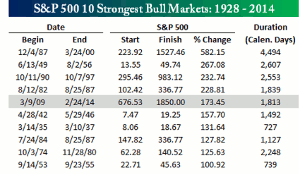
The S&P 500 (SPX) (SPY) made a new intra-day all-time high above 1,850 on Monday, but failed to close at an all-time high. With that in mind, the tables below provide an update of where the current bull market stands in comparison to prior bull markets in terms of duration and magnitude. For the purposes of this analysis, we consider a bull market to be any period where the S&P 500 gains 20% or more (on a closing basis) without a decline of 20% in between.
In terms of duration, the current bull market still ranks at number seven on the list. With Tuesday's new high, though, it is now less than a month away from taking out the 1982-1987 period as the sixth longest of all time. If the S&P 500 can hit a new high any time after 3/22, the next target will be the bull market of 2002 through 2007. In order to surpass that period and move into 5th place, the S&P 500 has to continue rallying through Memorial Day on 5/26. While the bull market has already been impressive, moving into the top spot for longest bull markets on record is still a ways off. In fact, the S&P 500 would have to go another 7+ years to 6/28/2021 in order to overtake the 1987-2000 bull market as the longest ever.
The current bull market may only rank at seven in terms of duration, but it is already at number five on the list of ten strongest bull markets. Looking at the list, it could be some time before we crack the top four. In order to crack the 228.81% threshold to move into the top four, the S&P would have to rally another 20% to about 2,225. Finally, before setting your sights on the title of strongest bull market on record, keep in mind that in order to overtake the 1987-2000 bull market, the S&P 500 would need to rally an additional 150% to 4,620. Don't hold your breath.
Sector Rotation During the Market's Round Trip
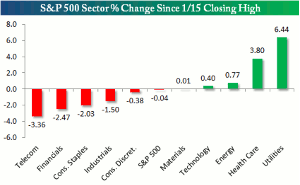
Even though we failed to make a new all-time high so far this week, the S&P 500 index is pretty much right back where it was on January 15 after experiencing a fall of nearly 6% and a subsequent rally of 6% in between.
Below is a look at major S&P sector performance during the market's recent "round trip" since the close on 1/15. As shown, the overall market is flat with the S&P 500 down just four basis points, but there have been clear winners and losers underneath the surface. Interestingly, the two smallest sectors of the market—Telecom (XTL) and Utilities (XLU)—are on opposite ends of the chart, with Utilities up the most at 6.44% and Telecom down the most at -3.36%. Keep in mind, though, that the moves in these two sectors have very little impact on the S&P given their extremely low weightings in the index.
Of the sectors that do have an impact on the index as a whole, Health Care (XLV), Energy (XLE), and Technology (XLK) are higher now than they were on 1/15 when the market made its last closing high. Financials (XLF), Consumer Staples (XLP), Industrials (XLI), and Consumer Discretionary (XLY), on the other hand, are all lower, and their underperformance is what has held the market back. These sectors have all bounced off of their early February lows, but they still haven't gained back all of their losses from the 1/15 to 2/3 pullback. Now that we're right back to prior highs, will the leaders (Health Care, Energy, Technology) continue to lead, or will investors move money out of recent winners and into the laggards?
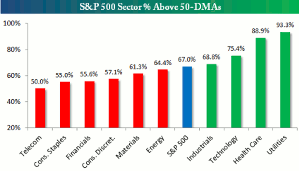
As shown in the second chart below, breadth levels are elevated for the areas of the market that have outperformed, and they're just above the 50/50 mark for the lagging sectors.
If you're looking to put money to work but don't want to chase overbought names, there are plenty of stocks still trading just above their 50-days in cyclical sectors like Industrials, Financials, and Consumer Discretionary.
By the Staff of BespokeInvest.com


