MoneyShow’s Tom Aspray takes a technical look at several stocks that have recently announced earnings to see whether their current weakness presents good buying opportunities.
It was one of those somewhat-rare days that the Dow Industrials closed unchanged for the day. The Dow Transportation Average was down 0.42% while the Nasdaq 100 gained just under 1% for the day. This, of course, was due in part to the 8% gain in Apple, Inc. (AAPL), but surprisingly the A/D ratios on the Nasdaq Composite were negative on the close.
For the NYSE Composite, the A/D ratios were flat and this has caused the McClellan oscillator to decline to +63 from + 116 last Tuesday. This could set the stage for a short-term pullback, though it is clearly an earnings-driven market and many eyes are on Amazon.com Inc. (AMZN), Starbucks Corp. (SBUX), and Microsoft Corp. (MSFT), which all beat their earnings estimates after the close. The new highs in the A/D line continue to favor an eventual upside move to stronger resistance.
Though beating estimates does not always guarantee higher stock prices, the market has not been very kind to those that report weaker-than-expected earnings. Even some stocks that beat analyst estimates have dropped sharply but does the current weakness present a buying opportunity in any of these three stocks?
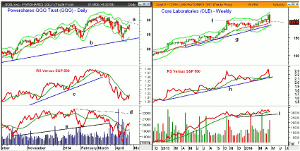
Chart Analysis: The beaten-down PowerShares QQQ Trust (QQQ), which tracks the Nasdaq 100, had nice gains as the highs from April 10 were finally overcome.
- The QQQ is now back above the quarterly pivot at $87.34.
- The daily downtrend, line a, is a bit higher at $89.06 with the weekly starc+ band at $91.48.
- The relative performance broke its uptrend, line b, in March signaling that it had lost its leadership role.
- The daily RS line is now trying to bottom as it has moved slightly above its WMA.
- The weekly relative performance (not shown) has turned up but is well below its WMA.
- The daily OBV also violated important support, line e, in March.
- The OBV has rallied back above its WMA and is now testing this resistance.
- More importantly, the weekly OBV (not shown) looks ready to move back above its WMA, which would trigger an AOT buy signal.
- There is short-term support now in the $87 area with the monthly projected pivot support at $85.66.
Core Laboratories (CLB) missed both on earnings and revenues, Thursday, as it closed down over 9% on the day.
- The weekly chart shows a large reversal from the April 17 high at $220.48.
- The 20-week EMA at $192.11 is now being tested as is the quarterly pivot at $191.98.
- The breakout level (line f) and former support has been slightly violated.
- The weekly uptrend, line g, is now at $186.58 with the weekly starc- band at $180.48.
- The weekly relative performance has reversed sharply from its new high. It may close below its WMA and the support (line h) this week.
- The weekly OBV has been in a tight range and is now testing its WMA as the volume was four times the average on Thursday.
- The weekly OBV has more important support at line I, and the daily has reversed sharply.
- The monthly projected pivot support at $185.73 is the next potential downside target.
NEXT PAGE: 1 Stock to Watch & 1 to Avoid
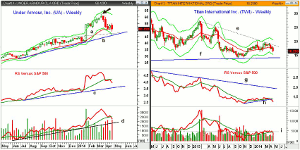
|pagebreak|Under Armour, Inc. (UA) reported a 50% jump in earnings and revenues rose 36%. The stock closed down 7.4% on the day but at one point was down over 10%.
- UA peaked at $62.40 in March and formed a weekly doji (see arrow).
- A weekly LCD sell signal was triggered the following week when it closed at $57.61.
- At Thursday’s low, it was down 15% after the sell signal.
- The weekly chart has next support, line a, in the $47.30 area.
- Further support is just a bit lower with the starc- band and weekly uptrend, line b, in the $46-$46.70 area.
- The weekly relative performance did confirm the recent highs but has been below its WMA for the past four weeks.
- The weekly OBV will close the week below its WMA but is still well above the trend line support at line d.
- The quarterly pivot is now at $53.57 with stronger resistance in the $56 area.
Titan International Inc. (TWI) reported that its sales dropped 7% in the 1st quarter and gross profits fell 43.6%. The stock was down 8.5% on Thursday.
- The weekly chart shows that the rally in early 2014 just tested the long-term downtrend, line e.
- The stock’s rally has stalled three times in the $19.50-$19.88 area.
- This week’s close looks as though it will be the lowest since early February.
- The weekly starc- band is at $15.20 with the major weekly support, line f, in the $14 area.
- The relative performance has been in a long-term downtrend since 2012.
- The RS line has recently broken support, line h, and is below its WMA.
- The OBV moved back above its WMA late last year but has been able to rally back to longer-term resistance at line i.
- The daily OBV (not shown) broke its support in March when the stock was trading near $18.50.
- There is first resistance at $17.25 with the quarterly pivot at $18.24.
What It Means: Both Core Laboratories (CLB) and Under Armour, Inc. (UA) have positive long-term charts suggesting that the current decline could set up a good buying opportunity. The weekly reversals do make it likely that we could see several weeks before they are ready to turn higher.
On the other hand, Titan International Inc. (TWI) looks negative from both a weekly and daily perspective and should be avoided.
How to Profit: For the PowerShares QQQ Trust (QQQ), go 50% long at $86.88 or better and 50% long at $84.72, with a stop at $82.37 (risk of approx. 3.9%).


