
Click
to Enlarge
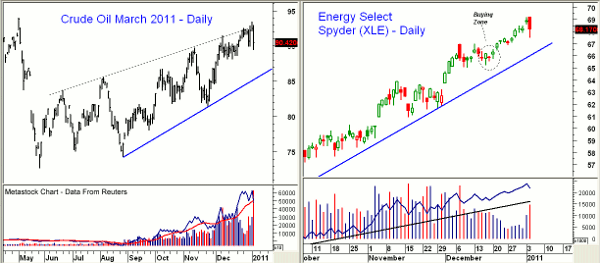
Chart Analysis: Crude oil traded in a wide range on Tuesday, settling significantly lower on very heavy volume. The daily chart shows what could be considered a rising wedge formation, which can often lead to very sharp corrections. Inventory numbers are due out today and the estimates suggest a large drop. This would normally be bullish for crude, but weaker-than-expected inventories and more selling in crude will suggest that sentiment may have changed. A break of support for March crude at $88 will indicate a drop to the $85.50-$86 area. The chart of the Energy Select Spyder (XLE) does look better technically, but it also traded in a wide range on Tuesday as it tested the first support at $67.50. XLE made a recent high of $69.19 and has not yet reached the 61.8% resistance at $71. The on-balance volume (OBV) is positive, having confirmed the upside breakout, and it is still in a solid uptrend.
What It Means: The trading on Tuesday in crude oil and XLE suggests that the rally from the mid-December lows may now be losing some upside momentum. The high price of crude is getting the public’s attention, which often occurs near market tops. A strong jobs report this Friday is expected to push crude higher, but it may not.
How to Profit: On December 14, I discussed the technical pattern in XLE and thought it looked attractive for purchase in the $65.40-$65.80 area. XLE did drop into this area over the next three days as the low was $65.25. If you are long XLE, I would now raise the stop to $66.77 and take profits on half the position at $69.76.


