
Silver is surging and gold has made new all-time highs, but the technicals indicate that risk is high and that better entry points may be presented in the months ahead.
The gold futures and widely held gold and silver ETFs made new highs for the year this week as silver continues to lead gold higher. For those already long, should you be buying more? And if you are not long, is it wise to buy in at current levels?
Since late 2010 and early 2011, the failure of volume to confirm gold’s highs has kept me cautious about the weekly trend, though my analysis of the major trend has remained solidly bullish.
Click to Enlarge
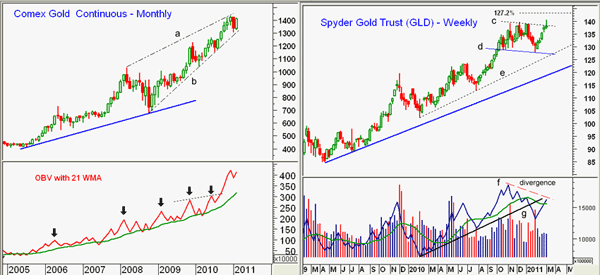
Chart Analysis: The monthly chart of the Comex gold futures shows that the longer-term rising wedge formation, lines a and b, is still intact. This could be quite a negative formation, but only once there is a decisive close below line b, in the $1300 area.
- Monthly on-balance volume (OBV) surged to significant new highs in December 2010, confirming the dramatic price gains. The arrows on the OBV going back to 2006 clearly show that the monthly OBV has lead gold prices higher
- The sharply rising weighted moving average (WMA) of the monthly OBV is also bullish for the major trend
- Weekly OBV (not shown) has failed to confirm the recent highs, while the daily OBV on the April futures has made new highs
The Spyder Gold Trust (GLD) made new all-time highs this week at $140.55 before pulling back on Thursday to test the breakout level at $137.50.
- Next support is in the $136.25 area, as this was the 61.8% resistance of the prior decline, and when it was surpassed, it signaled a further rally
- 38.2% support of the recent rally is at $135.70 and a close this week below that level would cause the formation of a negative weekly candle
- The 50% support level is at $134.20 with major weekly support still in the $127-$128 area (lines d and e)
- Weekly OBV did not confirm the late-2010 high (line f) and violated its uptrend, line e, in mid-January
- The weekly OBV has now rallied back to its weighted moving average and the former uptrend, and if it turns down, that would be the first sign that the recent rally could be over
- Daily OBV (not shown) is positive, but it is well below the highs made in late 2010
Click to Enlarge
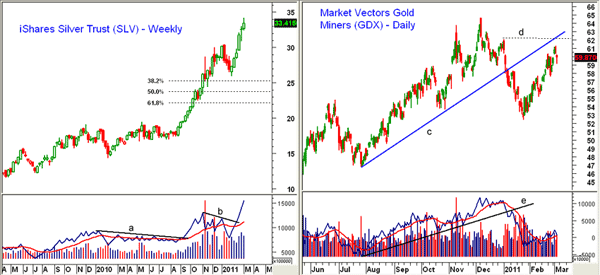
The weekly chart of the iShares Silver Trust (SLV) continues to look very strong as the late-January decline to $26 held well above the 38.2% support at $25.35.
- The 161.8% retracement target at $32.68 was exceeded this week. A rally from the January lows that was equal to the August-to-January rally could take SLV as high as $39
- There is initial support now in the $30-$31 area with more important support now at $28.40
- Weekly OBV completed its bottom formation in September 2010 as the resistance at line a was overcome
- The weekly OBV overcame short-term resistance (line b) the week ending February 12 when SLV closed at $29.21
The Market Vectors Gold Miners ETF (GDX) has had the weakest rally from the January lows. Though the 61.8% retracement resistance was overcome, GDX is still below its former uptrend, line c.
- The next key resistance level, line d, is at $62.20, and if surpassed, the recent highs may be tested
- Even though GDX has rallied from a low of $52.46 to over $61, the volume on the rally has been low
- The uptrend in the daily OBV (line e) was broken in January and the OBV has not improved much over the past few weeks. It is now close to dropping back below its weighted moving average
What It Means: Though the action in the silver futures and SLV is clearly positive, the failure so far of the weekly OBV makes me cautious about gold or GLD at current levels. The current monthly analysis does strongly suggest that they will be higher a year from now, but over the next few months, a further correction can’t be ruled out. GDX looks even more vulnerable to further declines, as its technical pattern remains the weakest.
How to Profit: Previously, I recommended hedging long positions in GLD by selling the March 130 calls against long holdings in the ETF. These were established at around $4.15, and I recommended closing them out on a close in GLD above $136.25. This occurred on February 22 and the March 130 calls opened the following day at $7.10. The loss of $2.95 on these was partially offset by the $2.15 profit on the earlier hedging recommendation, and of course, the hedged long positions are higher now.
The alternative way to hedge your long gold position did not work out as well, as I recommended buying Powershares DB Gold Double Short ETN (DZZ) at $8.56 or better with a stop at $8.11. This was filled on Feb. 15 at $8.48 and stopped out on Feb. 22 at $8.06 for a loss of about 5%.
Unfortunately, I did not recommend buying SLV when it closed above the $29.05 level. Even though the short-term outlook for GLD, SLV, and GDX is currently positive, the risk on new longs at current levels is too high, in my estimation, as stops would need to be uncomfortably wide. For those who are not already long precious metals, my analysis continues to suggest that you will have a better risk/reward entry in the next few months.


