After the largest market decline in Tokyo since 1987, selling was heavy in Europe and the US. The major US averages were hit hard on the opening as investors and traders rushed to raise cash. Will the carnage continue?
The market has attempted to stabilize after the opening as the major averages and the ETFs that track them have rebounded by midday trading and are well above the lows. The early Advance/Decline (A/D) indicators were extremely oversold with the ARMs Index (often referred to as the TRIN) hitting 12, which is one of the highest readings of the past ten years. Greg Morris, a respected technician, author, and friend, noted to me previous extremes of 14 in 1987, 15+ in late 1990 and early 2007, and 13+ in 2010.
Let’s take a closer look at the popular ETFs that track some of the major market averages.
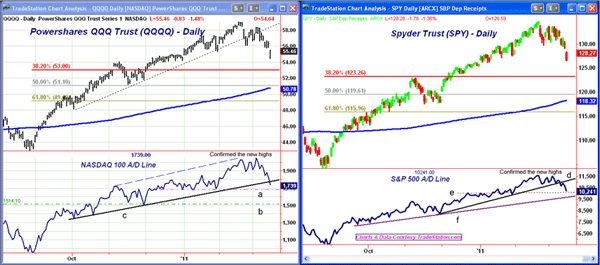
Chart Analysis: Strongest since the summer lows has been the Powershares QQQ Trust (QQQQ), which peaked at $58.97 on February 18 and had an opening low of $54.47. This was down 7.6% from the highs.
- The daily chart shows next support in the $54.00 area with the 38.2% support from the August lows at $53
- The 50% support level and the rising 200-day moving average (MA) are at $50.78-$51.10 (in blue)
- The Nasdaq 100 A/D line did confirm the market highs and made a new high on March 3, which is positive for the intermediate-term trend
- The A/D line has broken its uptrend going back to the October lows (line c), but it is already very close to an area of good support (line a)
- Much more important support is at line b, which corresponds to the November lows and the October highs
- Near-term resistance now stands at $55.80-$56.60 with much stronger resistance at $58-$58.25
The Spyder Trust (SPY) also gapped to the downside on the opening with a low so far of $126.50. This is not far above the chart support in the $126 area.
- There is further chart support at $125 that goes back to the December 2010 lows
- The 38.2% support level from the August lows is at $123.26. This also corresponds to October 2010 highs and should provide quite solid support
- The 50% support level is at $119.61 with the 200-day MA at $118.62 (in blue)
- The S&P 500 A/D line also confirmed the highs and has broken its initial uptrend, line d. It is already at next support (line e) with further support at the long-term uptrend (line f)
- There is first strong resistance at $129-$131 with much stronger resistance at $133
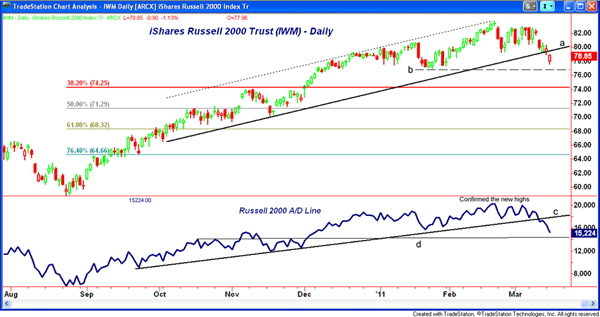
The iShares Russell 2000 Index (IWM) tracks the small-cap stocks and is the weakest of the major averages, having gapped below its uptrend (line a) on the opening.
- The low so far today at $77.57 is not far above the good chart support in the $77 area
- The 38.2% support and the November 2010 highs are at $74.25 with the 50% support at $71.25
- The Russell 2000 A/D line just made marginal new highs in February, which was a sign of weakness, and it has decisively broken its support at line c. The A/D line is already close to next support going back to fall 2010 (line d)
- IWM has a band of first resistance at $79.50 and then at $81.30 with much stronger resistance in the $82-$83 area
What It Means: Though some technical damage has clearly been done today, these three major averages got very close to first support on the opening lows. To suggest that this was a panic low, the QQQQ and SPY would have to close well off the lows and open higher Wednesday. A more likely occurrence is for the market to chop around and hold above the opening lows before a decent rebound can develop.
How to Profit: With no signs yet that momentum or the market internals have bottomed, the key support levels to watch are $53-$54 for QQQQ and $125-$126 for SPY. IWM should remain the weakest of the group, and a close below $76.90 would be a cause for concern.
If these support levels are violated, then the 38.2% retracement support comes into play. The market is already getting oversold and the sentiment picture is reaching levels more associated with a market bottom than a top. A day of three-to-one or better positive A/D ratios is needed to complete a short-term bottom.


