Investors have run for the exits this week, and with many major averages near critical support levels, we review two sectors that could determine the path of the overall markets in the weeks ahead.
Monday’s muted reaction to the demise of Osama bin Laden and the weak close set the tone for the week, and things got really ugly on Thursday. A week ago, the bullish sentiment seemed a bit too high when I wrote “Bulls Running—Don’t Get Trampled,” but I certainly did not expect the degree of selling that has occurred in some of the markets this week.
A more cautious approach was recommended, as I wrote “investors should adopt a more risk-adverse buying strategy, take some profits on longs when prices are moving higher, and be sure that protective stops are adjusted as prices move up.”
I certainly hope that those long the iShares Silver Trust (SLV) had their stops in place, as it is down 30% from last week’s highs.
Though there seems to be considerable debate about the cause of the slide, to me, that is less important than what it means to the markets from a technical standpoint. The degree of volatility in the metals and oil is not an encouraging sign for the stock markets, as many of the averages have reached critical support levels.
Of course, the market had been anticipating—or dreading—the monthly jobs report, as employment numbers earlier in the week were blamed by some for the markets decline. I think a weak jobs number may already be factored into the markets given Thursday’s drop, as more important support has been reached.
Of course, the better-than-expected jobs number could turn the market around. Today, I want to focus on two sectors that may determine the path for stocks in the coming weeks.
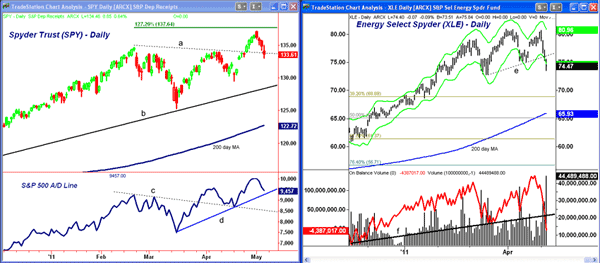
Chart Analysis: The Spyder Trust (SPY) dropped to a low of $133.02 on Thursday, retesting the breakout level from late April, line a. There is additional support at the gap from April 20 in the $131.35-$132.79 area.
- The daily chart has more important support at $129.51 and the April lows. The daily uptrend (line b) is now just below $129
- The rising 200-day moving average (MA) is now at $122.72
- The Advance/Decline (A/D) line made convincing new highs last week, which is positive for the intermediate term
- The short-term uptrend (line d) represents first support for the A/D line with stronger support at the former resistance, line c
- Initial resistance is at $135, and a daily close above this level would be the first sign that the correction is over. Further resistance is at $136 and the 127.2% target at $137.64
The Select Sector SPDR - Energy (XLE) was hit hard by the major plunge in crude oil as the July contract has already retraced over 38.2% of its rally from the August 2009 lows. XLE dropped below the previous lows and support at line e on Thursday.
- Most of Thursdays trading was below the starc- band, indicating an oversold market
- The March low of $72.90 now represents the next key level of support, with additional chart support in the $70 area. The major 38.2% retracement support is at $68.89
- Volume was heavy on the decline, as the longer-term support (line f) was broken. The on-balance volume (OBV) has recently made higher highs
- The weekly OBV (not shown) failed to make a new high last week and could complete a top formation if XLE does not rebound on Friday
- Initial resistance is now in the $76.50-$78 area
NEXT: Financials Still Weak; What to Watch for Now |pagebreak|
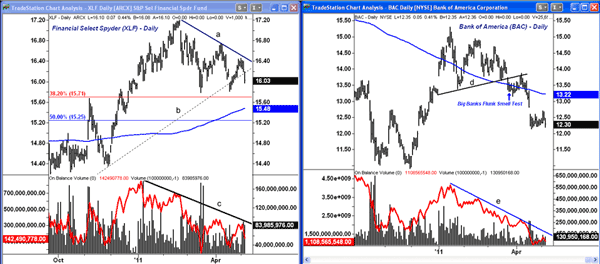
The Select Sector SPDR - Financial (XLF) has been lagging the overall market since last summer’s low. It peaked in February and has formed a well-established downtrend, line a, currently at $16.50.
- The uptrend (line b) was violated in early April, and Thursday’s weak close suggests a test of the 38.2% support at $15.71. The 200-day moving average is a bit lower at $15.48, with the 50% support at $15.25
- The daily OBV formed a divergence at the February highs, line c, which was negative
- It is still holding above the March lows, suggesting selling pressure has lessened. The weekly OBV (not shown) is below its weighted moving average (WMA).
I have been watching the big banks like Bank of America (BAC) since early in the year. BAC violated key support (line d) on March 23, leading to its inclusion in “Big Banks Flunk Smell Test.” Since then, the stock has lost another 8.7% and continues to act weak.
- The overall 61.8% support at $12.63 has been violated. Once below $12, there is support at $11.60 and then multi-year lows at $10.91
- The OBV is in a well-established downtrend, line e, and continues to make lower lows. The weekly OBV (not shown) is still holding above the 2010 lows
- Initial resistance lies at the gap in the $12.60-$12.82 area and there is stronger resistance in the $13.16-$13.30 area
What It Means: Clearly, Friday’s action will be important, but even if we have another down day, the probability of a rebound next week is still high. If we close up, it will be the start of the expected rebound.
The internal strength of the rally will be important to keep the pattern of higher highs and higher lows on the A/D line intact. My bias is still to the upside and strong market internals will support this view.
The Financial sector is still a concern, and you can only imagine how high the S&P 500 would be if XLF had kept pace with SPY over the past few months. If the market does turn lower, the selling in the financials could worsen.
The deterioration in the Select Sector SPDR - Energy (XLE) suggests that a deeper correction is becoming more likely. I will also watch the first rebound in XLE quite closely.
How to Profit: We have no current positions in SPY, XLF, or BAC, and I have no new recommendation for now.
Our long positions in XLE from $76.44-$77.07 were stopped out at $74.47, as I recommended raising the stop from $72.72 on a close from above $79.70. We took a 3.3% loss on this position, but booked some nice profits earlier in the year. No new recommendation for XLE at this time.


