These three stocks have posted big gains this year, but a proven technical measure shows all are trading at levels where chasing them is especially risky and not advised.
Even the renewed concerns over Greece’s debt negotiations were shrugged off by the stock market on Monday, as the major averages closed well off the day’s lows. Nevertheless, I still think this is no time to be buying aggressively or to be complacent.
A poor entry price, in my estimation, is the key ingredient in most losing trades. Therefore, the three key steps in my stock selection process are: 1) determining an entry level, 2) finding a proper stop level, and 3) figuring the approximate percentage risk if my stop were to be hit.
Of course, the Starc band analysis also plays an important role in stock selection, as when a stock or ETF is close to its weekly or monthly Starc+ band, it tells me quickly that it is a high-risk time to buy. This is because the stock or ETF is well above support, and so a protective stop under support has a high potential risk.
Even though these three Nasdaq 100 stocks may end up being market leaders in 2012, all are currently above their weekly Starc+ bands, so buying them now does not have a favorable risk/reward profile.
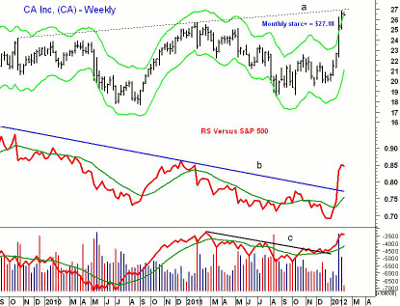
Chart Analysis: CA Inc. (CA) is a $13 billion IT software company that has been on the new 52-week high list frequently in the past few weeks. It is up 30.7% so far in 2012. The weekly chart shows trend line resistance, line a, in the $26.90 area.
- The longer-term charts reveal resistance from 2007 and 2008 in the $26.68-$28.48 area
- CA has closed above its weekly Starc+ band for the past two weeks with the monthly Starc+ band at $27.18
- The relative performance, or RS analysis, has broken its downtrend, line b, and has moved well above the October highs. This signals that CA should continue to outperform the S&P 500
- The on-balance volume (OBV) has moved well above its downtrend, line c, but is still slightly below the October highs
- There is minor support now at $26 with first strong support in the $24 area. If Friday’s high at $26.78 marked a short-term top, then the 50% Fibonacci retracement support is at $23.16
NEXT: 2 More High Flyers with Unfavorable Risk/Reward
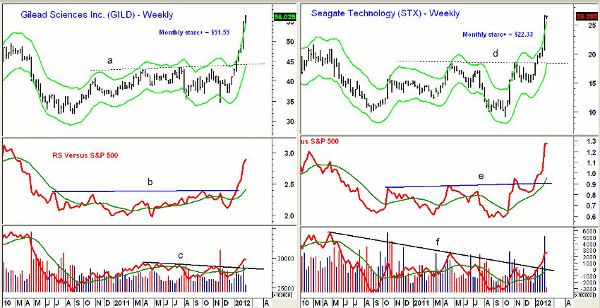
|pagebreak|Gilead Sciences Inc. (GILD) is a $42 billion biopharmaceutical company that was up 2.4% on Monday and has next resistance from 2008 at $57.63
- GILD has closed above the weekly Starc+ band for the past two weeks. It is also now trading well above the monthly Starc+ band at $51.55
- The relative performance has completed a major bottom, moving through two-year resistance, line b, in the middle of January
- The OBV has also overcome its resistance at line c, but it is lagging the price action
- First real support is in the $50 area, which is 12% below Monday’s close. Further support stands at $47.50 with major support, line a, in the $44 area
Seagate Technology (STX) is an $11.2 billion data storage company that is up over 60% so far this year. The company increased the dividend by 39% on January 26 and the stock currently yields 3.8%.
- STX is trading well above its weekly Starc+ band again this week and is 18% above the monthly Starc+ band
- The RS line broke through strong resistance (line e) in early November and then reaffirmed the breakout in early January when STX moved through resistance at line d
- Volume was very heavy last week, and while the OBV has moved through its downtrend, line f, it is still below the early-2010 highs
- The midpoint of last week’s range is at $23.50 with first real chart support at $21.50
- There is more important weekly support at $18.40 and the weekly Starc- band
What It Means: Managing risk is a key factor in successful investing or trading. For example, early bulls on STX are not yet showing any caution, as they are looking to roll their existing options into higher strike prices. Of course, they may turn out to be absolutely right, but they are equally likely to give up some nice gains.
Let’s say you are considering buying STX at last Wednesday’s closing price of $25.53, which is 3.2% below Monday’s close. The tightest reasonable stop, in my opinion, would be under $20.50, which was last week’s low. If you went long at $25.53 and were stopped out at $20.50, it would be a 19.7% loss. It would take a move to the $40 area to make the potential reward three times the risk.
The Starc band analysis clearly suggests that all three of these stocks are more likely to either start moving sideways or correct in the next month or so.
In June 2011, I noted that several tech giants, including NetFlix Inc. (NFLX), could fall further, as they were above their weekly Starc+ bands.
How to Profit: The strong relative performance patterns in these three stocks makes them worth watching on any corrections. Here are key support levels for each:


