
Materials stocks have been leading the recent rebound, and MoneyShow's Tom Aspray looks at the charts of four of the sector's top plays to determine the right entry points.
The stock market put in another strong performance Tuesday, as the Advance/Decline numbers were 3:1 positive—even stronger than Monday.
This supports the view that the correction from the September highs has traced out a flag or triangle formation. This is a typical continuation pattern, with upside targets for the Spyder Trust (SPY) in the $149 to $151 area.
The materials sector led the charge, as the Select Sector SPDR Materials (XLB) was up 2.4%. The materials stocks are involved in the discovery, production, and processing of both raw and synthetic materials.
XLB fell sharply lower in 2008, losing over 45%...but the gains in 2009 and 2010, of 40% and 16% respectively, erased those losses. So far this year, the XLB is up just over 12% (after losing 12.8% in 2011), as opposed to the small 0.2% loss in the Spyder Trust (SPY).
The two energy ETFs I favored last week, SPDR S&P Oil & Gas Exploration (XOP) and Select Sector SPDR Energy (XLE), gained 1.9% and 1.6% respectively. They still need to surpass further resistance to confirm that their correction is over.
For those underinvested in stocks, the Select Sector SPDR Materials ETF (XLB) looks attractive, as do these two chemical companies and one oil driller that also appear to have completed their corrections.
Click
to Enlarge
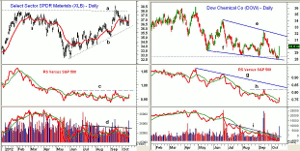
Chart Analysis: The Select Sector SPDR Materials (XLB) has tested the 38.2% Fibonacci retracement support of the rally from the June lows at $32.59. The Fibonacci levels can be a great tool to determine both entry and exit points.
- The slightly rising 200-day MA is at $35.96, with the 50% support level at $35.57.
- The daily relative performance analysis has been in a trading range since May, but it turned up Tuesday.
- A move in the RS line above resistance (line c) is needed to indicate that XLB is starting to lead the S&P 500 higher.
- The volume surged yesterday, and the daily OBV is above its WMA. The weekly OBV (not shown) is also positive.
- There is next resistance in the $38 area, with the 127.2% Fibonacci retracement target at $39.21.
- XLB also has a decent yield of just over 2%.
Dow Chemical (DOW) is up just 4% this year, and has lagged the SPY by well over 13% so far in 2012. The daily chart shows a pattern of lower lows (line f) since last May.
- The 50% Fibonacci retracement support at $28.30 was slightly broken last week, with the 61.8% support at $26.46.
- The daily relative performance has moved back above its WMA, with key resistance now at line h. The major downtrend and longer-term resistance is at line g.
- Volume was double the average yesterday, but the on-balance volume (OBV) is still just slightly below its WMA.
- The weekly OBV (not shown) is below its WMA, but has formed a slight positive divergence.
- There is next resistance at $30.60, with the downtrend (line e) and the 200-day MA at $31.83.
- DOW currently yields 4.5%.
NEXT: Tom's Analysis of 2 Smaller-Cap Plays |pagebreak|
Click
to Enlarge
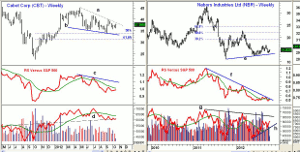
Cabot (CBT) is a much smaller, $2.4 billion specialty chemical company that peaked in May at $44.97, and came close to the 50% Fibonacci retracement support at $33.65 in September.
- The weekly chart shows a flag or continuation pattern (lines a and b).
- The downtrend is at $38.60, and a close above $40 will complete the corrective pattern.
- The upside targets from the flag formation are in the $48 area.
- The weekly relative performance made new highs in April, confirming the price action.
- The RS line is currently below its WMA and the downtrend (line c).
- The OBV made a new high in July, as it was stronger than prices. The OBV has now reached good support (line d), and a move back above its WMA would be positive.
- There is short-term support now at $36.70 to $37.20.
- CBT currently yields 2.2%.
Nabors Industries (NBR) is a $4.3 billion dollar oil and gas land drilling company that peaked in February at $22.73 but then dropped sharply to a low of $12.51 in June.
- The weekly chart shows a shallow uptrend (line e), and this support was just retested last month.
- The relative performance is trying to bottom out, as it is now testing the downtrend from the 2011 highs.
- The RS line is slightly above its WMA, and could complete a bottom in the next few weeks if NBR does move higher.
- The weekly OBV is acting stronger than prices, having bottomed in April and moved above its WMA in July.
- The uptrend in the OBV (line h) does indicate accumulation, with next resistance at line g.
- There is next resistance at $15.50 to $16.20, with the major 38.2% resistance from the 2011 highs at $19.15.
What it Means: In the next week or so, we should have further evidence to tell us that the materials stocks have bottomed. The strong gains Tuesday create an initial buy level near the middle of Tuesday’s range, with an additional entry at the last week’s lows.
The XLB looks like a good risk-reward purchase for those with low exposure to equities, while the three stocks have a larger risk but also the potential for a better return.
How to Profit: For the Select Sector SPDR Materials (XLB), go 50% long at $37.26 and 50% long at $36.84, with a stop at $35.37 (risk of approx. 4.5%).
For Dow Chemical (DOW), go 50% long at $29.44 and 50% long at $28.84, with a stop at $27.76 (risk of approx. 4.7%).
For Cabot (CBT), go 50% long at $37.08 and 50% long at $36.66, with a stop at $35.42 (risk of approx. 3.7%).
For Nabors Industries (NBR), go 50% long at $14.52 and 50% long at $14.14, with a stop at $13.36 (risk of approx. 6.7%).


