
As the one-two punch of weak economic data and lukewarm earnings reports have thrown road blocks at the stock market, MoneyShow's Tom Aspray looks at two important developments to decipher what the coming week might bring.
The S&P 500 violated the widely watched support at 1539 on Thursday with the German DAX Index also closing below its support at 7500. The Nasdaq 100 was hit the hardest, losing 1.4%, while the Dow and S&P 600 lost around 0.60%.
The Dow Jones Utilities actually closed higher and the Dow Transports were only slightly lower. This could be a short-term positive as the Transports had been leading the market lower and now could be ready for a rebound.
The markets will need a huge rally Friday to avoid a negative weekly close and the futures are higher again in early trading. The Advance/Decline lines on both the NYSE and S&P 500 have not yet violated strong support as the small caps are continuing to lead the market lower.
There were important developments this week as the number of NYSE stocks making new highs has dropped sharply as it has been deteriorating since April 8. Bond prices were higher and yields have dropped further signaling that the trend of higher yields that has been in place since last summer is likely over.
The movement into the safety of the Treasury market, even though they may get a negative total return, was one of the triple threats that the market was facing when it opened Monday. The changes in these two markets may give us some insight to what the markets may do in the week ahead.
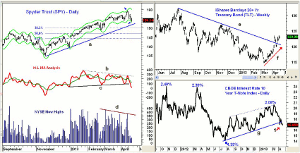
Click
to Enlarge
Chart Analysis: The Spyder Trust (SPY) tested the daily starc+ band on April 11 and just five days later on Thursday reached the starc- band.
- The previously identified key support at $153.77 was broken intra-day as the low was $153.55 before SPY closed at $154.14.
- The quarterly pivot is at $152.75 (see full list) with the daily uptrend, line a, at $152.
- The 38.2% Fibonacci support is at $150.16 with further important support at $148.73, which was the late February lows.
- The 50% retracement support is at $147.20.
- The H-L MA analysis has been forming lower highs over the past few months, line b.
- The key support going back to late 2012, line c, has now been broken.
- The number of new highs peaked at 440 early in the year and then formed lower highs since March, line d.
- Only 63 stocks made new highs on Thursday while the number of new lows rose to 98 on Wednesday
- There is initial resistance now at $156 and then stronger at $157.49-$158.13.
The iShares Barclays 20+ Yr Treasury Bond ETF (TLT) rose further Thursday as its daily downtrend, line e, was broken on April 4.
- The uptrend for TLT (line f) signals that longer-term rates are moving lower.
- The next major resistance is in the $125 to $127.19 area.
- The weekly technical studies (see chart) are positive.
The chart of the 10-Year T-note yields shows that they bottomed last July at 1.39% and rose to a high of 2.08% in early March.
- The yields dropped sharply from the highs, breaking the uptrend, line g, on April 4.
- The yields rose for five days before again turning lower.
- On Thursday, the yield dropped below its prior low (point 1), which confirmed the break of the uptrend.
- The next major support in terms of yield is at 1.55-1.56%, which corresponds to the November and December lows.
What it Means: The futures are holding some decent gains before the opening as are the euro markets. The major averages are likely to see a rebound over the next week.
Any rebound will need to be watched closely as my current view is that it will be part of the top-building process.
The decline is stock prices is already bringing them back in line with the economic data as stock prices seemed to have gotten ahead of the economy.
How to Profit: No New recommendation


