With volume expected to be down during this shortened trading day, MoneyShow’s Tom Aspray takes to the charts to decipher the market’s next post-holiday move.
The stock market rebound appears to have stalled on Tuesday as Eurozone and Middle East concerns had the market’s attention. Overnight data suggesting that China’s economy was slowing has pushed the futures lower in early trading. Higher crude oil prices are not helping.
The market internals, Tuesday, were weaker than prices and with a host of economic data on Wednesday, followed by the monthly jobs report on Friday, some fireworks seem likely. On a lower close Wednesday, the short-term momentum will point lower so the main question is whether stocks will have a soft or hard landing.
For the past few years, weaker-than-expected job numbers have pressured the stock market but now better-than-expected numbers could be a short-term negative for the market. If the jobs numbers are good, it will again raise fears that the Fed will stop its bond-buying program earlier than expected.
Can the technical evidence clarify whether stocks are ending their correction or if the stock market is due for another heavy wave of selling?
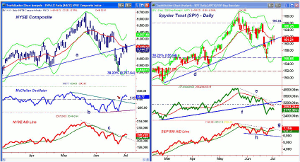
Chart Analysis: The daily chart of the NYSE Composite (NYA) shows that it rebounded back to its former uptrend, line a, and its 20-day EMA before closing lower Tuesday.
- There is next support in the 9000 area and then at 8915, which was the June 25 low.
- The 38.2% Fibonacci retracement support is at 8767, which is 4% below current levels.
- The McClellan oscillator (OSC) made its low at -311 on June 5 and then formed higher lows at -276 as the NYSE was making its low.
- This bullish divergence, line b, is consistent with the formation of a market bottom.
- The OSC broke its downtrend (see arrow) on June 26, which is also a positive sign.
- Even if the NYSE Composite (NYA) makes a new low, it is likely that the OSC will form another divergence.
- The NYSE Advance/Decline did confirm the recent lows but then moved back above its WMA and broke its downtrend.
- This makes the A/D ratios important on a further decline.
- There is initial resistance at 9251, which is the quarterly pivot and then more important at 9412.
The Spyder Trust (SPY) has been able to close above its former downtrend, line d, and closed on its 20-day EMA Tuesday.
- There is next resistance at $163.47 and then at the June 18 high of $165.99.
- The on-balance volume (OBV) has stayed below its declining WMA and further resistance (lines e and f) on the recent rally.
- The weekly OBV is now just slightly below its WMA.
- The S&P 500 A/D line has been more positive as it has moved above its downtrend, line g, and its WMA.
- The A/D line did make lower lows, line h.
- There is next support at $159.25 and then the doji closing low at $158.57.
- The 38.2% Fibonacci retracement support at $155.94 was slightly violated on June 25.
- The monthly projected pivot support is at $156.56.
NEXT PAGE: Two Buy Candidates
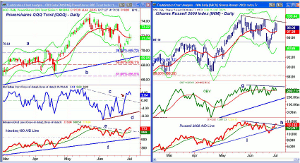
|pagebreak|The PowerShares QQQ Trust (QQQ) closed just barely below its flat 20-day EMA and the quarterly pivot at $71.18.
- There is further support at $70.79 with the 38.2% Fibonacci support at $69.72.
- This support was broken on June 24 when the low was $69.15.
- The uptrend is at $68.99 with the 50% retracement support at $68.11.
- The McClellan oscillator on the Nasdaq 100 shows a similar pattern as the NYSE.
- The OSC has formed two positive divergences (line d) and then was able to break its downtrend, line c, on the recent rally.
- The Nasdaq 100 A/D looks stronger than either the NYA or SPY as it has clearly broken its downtrend, line e, and is well above its rising WMA.
- The A/D line has so far held above the longer-term uptrend, line f.
- There is initial resistance at $72.82 to $73.76.
The iShares Russell 2000 Index (IWM) has closed above its 20-day WMA at $97.28 for the past four days.
- A close back above the $100 level would be an upside breakout.
- The OBV has held up well on the correction but is still stalled below the resistance at line g.
- The OBV has major support well below current levels and the weekly OBV is above its WMA.
- The Russell 2000 A/D line has just slightly moved through its resistance at line h.
- The uptrend in the A/D line was slightly broken on the recent correction, line i.
- The quarterly pivot support is at $96.03 and then at $94.63, which was the recent low.
- The projected monthly support is at $94.49.
What it Means: The McClellan oscillator formations do suggest that a bottom is forming but a brief drop below the June lows is still possible. The seasonal pattern in the S&P 500 (see chart) shows that a low is typically formed in the first few days of July.
Of the four, the PowerShares QQQ Trust (QQQ) looks the best and then the iShares Russell 2000 Index. Until the A/D lines make new highs, it is not the time to be an aggressive buyer.
How to Profit: For the PowerShares QQQ Trust (QQQ), go 50% long at $70.44 and 50$ at 69.28, with a stop at $67.67 (risk of approx 3.1%).
For the iShares Russell 2000 Index (IWM), go 50% long at $96.68 and 50$ at $95.06, with a stop at $91.29 (risk of approx 4.7%).


