The weekly scan of S&P 500 stocks using starc band analysis reveals not only those stocks that may be vulnerable to profit taking, but also helps to identify those that may be the next market leaders. MoneyShow’s Tom Aspray analyzes the risk on four of these stocks.
It was another positive week for stocks as the Dow Transportation Average led the way, gaining 2.3%, followed by a 1.2% gain in the Dow Utilities. Small caps were also strong with the Russell 2000 over 1.3%.
Oil and gas was the top industry group, up over 2%, while the technology sector was hit hard as Microsoft Corp. (MSFT) was down 11% last Friday after testing its daily starc+ band early in the week.
Given the S&P 500’s rally from the late June lows, I was cautious in last week’s column Should You Be Buying Now even though I acknowledged that another 1-3% on the upside was still possible. There are still no signs of a top with first support at last Wednesday’s low.
In determining whether a new position should be established or not, you have to consider whether you are buying near resistance or selling near support. By determining your stop level, you can determine the risk, which should determine whether the position is taken or not. Focusing on risk is the key because if you take too many high-risk positions, the odds of success are not in your favor.
My weekly starc band scan of the stocks in the S&P 500 reveals that quite a few stocks closed last week above their weekly starc+ bands. As a reference, the Spyder Trust (SPY) closed last Friday just 1.5% below its weekly starc+ band.
It is important to remember that just because a stock closes above its weekly starc+ band (overbought), it does not mean that the stock cannot still move even higher. But each consecutive week a stock closes either above its starc+ or below its starc- band (oversold), the odds increase that prices will at least consolidate, if not reverse. In the summer of 2011, the consecutive closes in gold above the monthly starc+ bands warned of a significant trend change.
On the table, I have also included the % that they are above their 200-day moving average. The first eight stocks on the list are above their weekly starc+ bands. While that does not mean they can’t still go higher, they are a high-risk buy at current levels.
At the top of the list is Xilinx Inc. (XLNX), which closed last week 1.6% above its starc+ band and is 12.5% above its 50-day MA. It is also important to determine whether the stock is above or below long-term resistance. Let’s look at the four most interesting stocks on the list.
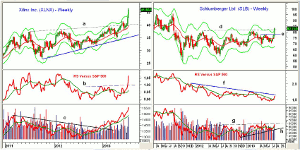
Chart Analysis: Xilinx Inc. (XLNX) is a $12.1 billion dollar semi-conductor company that reported earnings last week that their 1st quarter net income was up 21%.
- Since the June low of $37.63, it is up 21.9% and has already exceeded the quarterly R2 resistance.
- The first support is in the $42.60 area, 7.1% below Friday’s close, which is quite a bit of risk.
- There is more important support at $41.47, which was the May high.
- The weekly chart has multi-year support, line a, in the $40 area with the 20-week EMA at $39.50.
- The relative performance dropped to its WMA in mid-June before turning sharply higher.
- The weekly on-balance volume (OBV) broke almost a two-year downtrend, line c, in late 2012.
- This was sign of accumulation and volume was strong last week.
Schlumberger Ltd. (SLB) also reported very strong earnings last week as it gapped 3.7% higher Friday on three times the average daily volume.
- The close last week was above the early 2013 high at $82, as well as the early 2012 highs.
- The next major resistance from 2011 is in the $95.53, which is a legitimate target in 2014.
- There is initial support now at $77.78 (line e), which was the May high.
- The tightest stop would need to be under the $75.90 level. The quarterly pivot is at $73.23
- This is a risk of 8.2% from Friday’s close
- The relative performance has moved above its WMA in the past two weeks but is still below the long-term resistance.
- On Friday, I noted the sharp improvement in the daily RS analysis of the energy sector.
- The weekly OBV has formed higher lows since late last year, line h, but needs to move above the resistance at line g, to confirm the price action.
NEXT PAGE: Two Overbought Healthcare Stocks
|pagebreak|Zimmer Holdings Inc. (ZMH) is a $14.2 billion medical appliances and equipment company, which reports earnings on Thursday. Analysts are looking for a 2.5% increase in revenue and an EPS of $1.44.
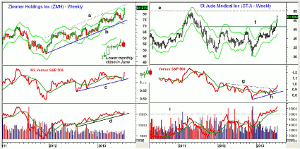
- It is also important to review the monthly charts and in June (see insert) ZMH closed below the May lows.
- This is the first time this has happened since 2012 and is a sign of weakness.
- There is first support at $81.92 to $80.55 with the quarterly pivot at $76.85.
- A stop under this level would be a risk of 9.2% going into earnings.
- The weekly uptrend, line b, is in the $74 area with the parallel upper trend line at $87.44.
- The relative performance has turned up sharply from its support at line c.
- The weekly OBV has also held at support, line d, but is below the May highs.
St. Jude Medical Inc. (STJ) is a $14.8 billion dollar medical equipment and appliance company that reported earnings last week. It has a current yield of 1.9%.
- In last Wednesday’s report, it beat expectations on both revenues and earnings.
- It has gained 29.9% since the April low of $39.79.
- The long-term chart shows that it is now approaching the long-term resistance (line e) at $54.75, which was the 2006 high.
- There is weekly support now at $46.46 with the quarterly pivot at $44.51.
- A stop under the late June low at $43.97 would be a risk of 14.9%.
- STJ is currently 27% above its 200-day MA at $40.66.
- The relative performance has completed its bottom formation by moving through resistance at line g.
- The weekly OBV looks even better as it has moved through the major resistance at line i.
- The daily OBV has also confirmed the breakout so both the weekly/daily OBV are positive.
What it Means: Of the four stocks, I think the prospects are the best for Schlumberger Ltd. (SLB). I recommended several other oil stocks last week and think it now appears to be a market-leading sector. A good entry for SLB may take several weeks to develop after last Friday’s gap.
The risk analysis shows the dangers of buying at last Friday’s close, especially a stock like Zimmer Holdings Inc. (ZMH) ahead of its earnings report this week.
How to Profit: No new recommendation


