With the rise in interest rates, the prospect of significant capital loss is now a real problem for many bond holders, and MoneyShow's Tom Aspray takes a technical look at three of the largest bond funds that could deliver the most pain.
The stock market followed a similar pattern again Tuesday as the early selling was well absorbed and the major averages closed higher. The Nasdaq 100 got a boost from the sharp gain in Apple (AAPL) after Carl Icahn revealed he had established a large holding.
The positive market gains, however, were accompanied by negative market internals as the declining stocks led the advancing ones by a 1.3 to 1 margin. Also, more stocks made new 52-week lows than made new 52-week highs.
Stocks investors paid little attention to Tuesday's rise in rates, but bond holders should pay attention. The technical deterioration in three of the largest bond ETFs indicates they are vulnerable to another sharp drop in prices, which may mean more pain for bond holders.
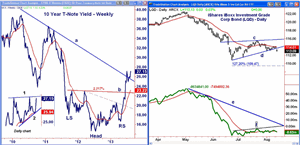
Chart Analysis: The weekly chart of the 10-Year T-Note yield shows the sharp recent rise in rates as the early July high at 2.725% is now being tested.
- The weekly chart shows the completion of the reverse head and shoulders bottom formation with the move through the neckline, line b.
- The longer-term downtrend, line a, has also been overcome.
- The upside targets from the bottom formation are in the 3.19% area.
- The insert of the daily chart on the lower left shows that yields are in a short-term flag formation, lines 1 and 2.
- This formation has upside targets in the $2.900 to $2.920 area.
- In 2011, the yields moved well above the 3.200% level.
The iShares iBoxx Investment Grade Corporate Bond Fund (LQD) has net assets of $19.51 billion with a current yield of 3.96%.
- At the May high of $122.57, the yield was 3.52%, but LQD is already down 7.7% from these highs.
- The daily chart shows the completion of a flag formation, lines c and d, with Tuesday's drop.
- This is a typical continuation pattern or a pause in the downtrend.
- This pattern reinforces the negative weekly outlook and is consistent with even lower prices.
- The 127.2% Fibonacci retracement target is at $109.47, which is 3.2% below current levels.
- The OBV did not rally with prices (line f), which was a negative sign.
- The OBV topped out in May when it dropped below its WMA and now has strong resistance at line e.
- The weekly OBV is also negative OBV and below its WMA.
There is initial resistance at $114.78 with the quarterly pivot at $115.94.
NEXT PAGE: What It Means
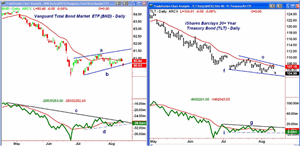
|pagebreak|The Vanguard Total Bond Market ETF (BND) has net assets of $109.77 billion with a current yield of 2.51%. It is designed to track the performance of the widely followed Barclays US Aggregate Float Adjusted index.
- In early May, BND hit a high of $84.25 with an all-time high in July 2012 of $85.36.
- The lower boundary of its flag formation, line b, is now being tested.
- The 127.2% downside target is at $79.49 with the early 2011 low at $79.00.
- The OBV has dropped back below its WMA after just moving slightly above its downtrend, line c.
- A drop below the OBV support at line d will confirm a further decline.
- There is first resistance at $80.84 and the 20-day EMA. The quarterly pivot and more important resistance is at $81.73.
The iShares Barclays 20+ Year Treasury Bond ETF (TLT) tracks the longer end of the yield curve with a current yield of 2.87%.
- TLT failed to rally from the July lows as it has formed lower lows (line f) and gapped to the downside Tuesday.
- The quarterly S1 support is now at $100.95 with the August 2011 low at $97.35.
- The daily on-balance volume (OBV) has dropped back below its WMA after testing resistance at line g.
- The OBV has not yet confirmed the recent lows with key support at line i.
- There is first resistance now at $107.40 to $108.28 and then in the $110 area.
What it Means: Despite Fed comments to the contrary, a recent survey of economists are looking for the Fed to cut back on their bond buying or to “start tapering” in September. It looks like the bond market is already convinced.
The technical outlook suggests that rates are going to move higher again after stabilizing since early July. This may cause further inflows to the stock market or possibly a move into higher yielding junk bond ETFs like the SPDR Barclays High Yield Bond (JNK), which has just rallied back to the key 61.8% resistance.
At the end of May I recommended that investors “summer-proof” their portfolios and part of the process was to shorten the maturity of their bond portfolios.
How to Profit: Bond holders should now have a plan in place as a further rise in rates is likely to put them in an even a more difficult position without a plan.


