
An important part of the Dow Jones Transports are railroad stocks, writes MoneyShow's Tom Aspray, which may be the reason why he has been watching them so closely, as of late.
The Dow Jones Transports were up slightly more than the Dow Industrials Tuesday and, as I noted Monday, they have been stronger since the 2009 low, as well as, in 2013. Yesterday's action caused some slight improvement in the technical studies, so the overall market could again try to move higher.
A sharply lower close, on the other hand, will set the stage for a drop back to the August lows, which is likely to turn the market sentiment more negative. It will take a more sustainable rally, with much better A/D numbers, to suggest that the market's correction is over.
The railroad stocks are an important part of the Dow Transports, and the rail shipment of crude oil from the Bakken shale and other sources has given these stocks a boost, as commodity shipments have declined. The high crude oil prices are obviously a positive factor.
Therefore, the railroad stocks are one industry group that I have been watching closely, as they have corrected from their highs and are no reaching good support. These are three railroad stocks in particular that I am watching.
Click
to Enlarge
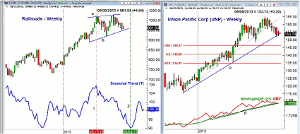
Chart Analysis: The chart of the Railroad Index shows an apparent flag or continuation pattern, lines a and b.
- The lower boundaries are now being tested with more
important support at the June lows.
- The seasonal analysis indicates that the railroads
typically top on May 17, line 1.
- After a fairly steady decline they generally bottom
in the October 4 time period, line 2.
- The railroads rise gradually into March before they
accelerate to the upside.
Union Pacific (UNP) has been, as of so far in 2013, it is up over 24%. It peaked in late July at $165.18 and reached a low last week of $154.04. It has a current yield of 1.86%.
- This was a drop of 6.7% from high to low, as the
uptrend from the November 2012 lows, line c, is now being tested.
- The 38.2% Fibonacci retracement support from the late 2012 lows
is at $146.37.
- This is just slightly below the June low at $148.45.
- The more important 50% retracement support stands at
$140.60.
- The weekly OBV did confirm the July highs and has now
dropped back to its uptrend (line d) and it's WMA.
- The monthly pivot and first resistance is now at
$156.71 with stronger at $158.89.
NEXT PAGE: What It Means:
|pagebreak|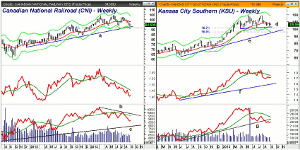
Click
to Enlarge
Canadian Pacific Railroad (CNI) is expected to be one of the railroads that will benefit the most from the increased oil shipments by rail. It has a current yield of 1.68%.
- The weekly uptrend, line a, that goes back to the
early 2012 lows, is now at $92.68.
- The 61.8% retracement support is at $91.66, as the
50% support at $94.12 was broken in June and also last week.
- The relative performance peaked ahead of prices in early
March, and by the end of the month, was in a clear downtrend.
- The RS line is still well below its declining WMA.
- The weekly OBV did form a divergence at the recent high, line b,
and is below its declining WMA.
- The OBV has long term support at the uptrend, line c.
- There is initial resistance at $96.16 and the monthly
pivot.
- A close above the $99.30 level should be enough to
shift the momentum to the upside.
Kansas City Southern (KSU) rallied in July to a high of $118.68, which was just below the May high of $118.88. It has a current yield of 0.77%.
- There is the next trend line support, line d, at
$102.68, with the 38.2% Fibonacci support at $101.06.
- The weekly starc- band is at $97, with the 50% support at $95.60.
- The longer term uptrend, line e, is at $94.55.
- The relative performance is still in a long term
uptrend, though it is currently below its WMA.
- The RS line has long term support at line f.
- The weekly OBV has been acting weaker, as it dropped
below its WMA in May.
- The uptrend in the OBV that goes back to the June
2012 low, line g, has now been broken.
- The key resistance is now at $110.68, which is the
quarterly pivot level.
What It Means: The daily technical studies on all three of these railroad stocks are still negative. They would take a couple of weeks to give new buy signals. This, combined with the negative weekly analysis, still favors the sidelines for now, but these stocks could lead the market into the end of year. Based on starc- band analysis, they are not nearly as oversold as the Dow stocks.
How To Profit: No new recommendation at this time.
Portfolio Update: The long position in the iShares Dow Jones Transportation (IYT) from $110.25 was stopped out with a small profit at $112.38.


