
As the energy sector enters the fall months when it typically bottoms, MoneyShow's Tom Aspray goes prospecting for buy candidates in preparation for its next rally.
The comments from the Republican leadership over the weekend have increased investor fears that the debt ceiling will not be raised in time. The European markets are trading lower with the German Dax Index down 1% in early trading. The S&P and Dow futures are showing sharp losses with the S&P testing last week’s lows in early trading.
The crude oil futures are also down over 1% in early trading after recording some nice gains last week. In the middle of last month, there were some positive technical signs in the energy sector suggesting that it was starting to lead the market higher.
The Select Sector SPDR Energy (XLE) typically forms a double bottom in October and November but then records its sharpest gains between February and June. In 2010, the fall low set the stage for a powerful rally into the highs the following May.
Several of our buy levels from last month’s article were hit, but I still think that this sector offers some good opportunities. Let’s take a look.
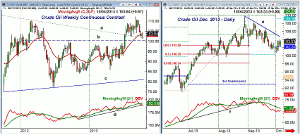
Click to Enlarge
Chart Analysis: The weekly crude oil chart shows the breakout above the resistance, lines a and b, last July.
- Crude subsequently moved above the yearly resistance from 2012 at $110.55.
- The correction over the past five weeks has taken crude oil back to the breakout level and support at lines a and b.
- The close last week was just above the 20-week EMA at $103.13.
- The weekly OBV did confirm the recent highs and is now testing the uptrend, line d, that goes back to late 2012.
- The OBV turned up last week but is still slightly below its WMA.
- There is first weekly resistance at $105.
The daily chart of the December crude oil contract shows that the 50% Fibonacci retracement support from the June lows at $100.35 was approached last week.
- A drop below this level at $100.36 would signal a drop to the 61.8% support at $98.14.
- Crude opened the 3rd quarter above its pivot at $92.92 and stayed above it for the entire quarter.
- The close last week was above the 4th quarter pivot at $102.20 with the daily downtrend, line e, at $104.50-$105.
- The daily OBV made a new high on September 12 and dropped below its WMA three days later.
- The daily WMA is still declining so a retest of last week’s lows is possible.
NEXT PAGE: 2 Energy Picks
|pagebreak|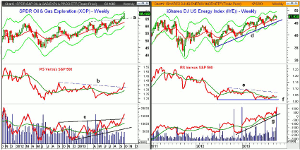
Click to Enlarge
The SPDR Oil & Gas Exploration ETF (XOP) closed sharply higher last week as it overcame resistance at line a two weeks ago. There is initial weekly support now at $64.46.
- The rising 20-week EMA is at $62.84.
- The weekly relative performance has been above its WMA since early August and overcame year-long resistance, line b, last week.
- The RS line is well above its now rising WMA.
- The weekly OBV has also broken out to the upside as the resistance at line c was overcome.
- The OBV tested its rising WMA in August.
- The close last week was well above the quarterly pivot at $65.70 with further support at $64.50.
- The quarterly R1 resistance is at $71.46 with the monthly starc+ band for October at $73.04.
The iShares DJ Energy Index (IYE) is a less diversified energy ETF than XOP. It has a 22% holding in Exxon Mobil (XOM) and over 13% in Chevron Corp (CVX), with a yield of 1.6%.
- IYE had a low last week of $46.75 as it held above the rising 20-week EMA at $46.50.
- The weekly close was above the quarterly pivot at $47.13.
- The projected monthly pivot support is at $46.03 with the August low at $45.33.
- The relative performance has turned up from its WMA but needs to move through resistance at line e, to complete a bottom.
- The volume was very heavy last week as it was the highest since the start of the year.
- The on-balance volume (OBV) has been in a strong uptrend, line g, since late 2012.
- The OBV made a significant new high last week.
- The weekly starc+ band is at $49.60.
What it Means: There are no strong signs yet that the correction in crude oil is over but the intermediate-term and long-term trends are positive.
Our buy level in SPDR Oil & Gas Exploration ETF (XOP) was just missed and I would look to buy on a pullback. We are long Select Sector SPDR Energy (XLE) and I would buy iShares DJ Energy Index (IYE) near the recent lows.
How to Profit: For SPDR Oil & Gas Exploration ETF (XOP), go 50% long at $66.04 and 50% at $64.78, with a stop at $62.54 (risk of approx. 4.4%).
For iShares DJ Energy Index (IYE), I would buy $46.32 with a stop at $44.93 (risk of approx. 3%).
Portfolio Update: For Select Sector SPDR Energy (XLE), should be 50% long at $82.84 with a stop at $79.27. On a move above $84.90, raise the stop to $81.33.
For Ultra Petroleum Corp (UPL) should be 50% long at $20.52 and 50% at $20.28, raise the stop to $19.87. Sell 1/3 at $23.12 and raise the stop to $20.70.
For Devon Energy (DVN), should be 50% long at $57.94 with a stop at $55.67.


