Continued overall strength in the market is bound to result in choppy conditions every so often, but MoneyShow’s Tom Aspray highlights some stocks that are in long-term uptrends.
A sharp 1.9% drop in Hong Kong’s Hang Seng Index overnight is putting pressure on the other global markets as all the major Eurozone averages are lower. As was the case yesterday, the futures are down sharply before the opening with a 100-point loss in the Dow. The early selling was well absorbed on Tuesday so the close will be more important.
The daily studies are still range bound as are the major averages, while the weekly studies, like the OBV, did confirm the recent highs. A daily close in the S&P 500 below 1746 could signal a decline to the 1726-1732 area but it and the Dow Industrials have been holding up the best.
If we get a deeper correction, those stocks that are trading at all-time highs are likely to be the most vulnerable. Of course, there is always the potential for a deeper correction, and as I noted last week, it is not a time to be complacent about your portfolio.
Still, there are many stocks that are in long-term uptrends that have corrected back to support and shows signs that they are bottoming Three such stocks popped up on my radar yesterday, one in a long-term favorite sector while the other two are in sectors that have been recently strong.
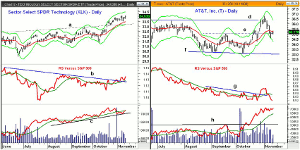
Chart Analysis: The Sector Select Technology (XLK) broke through several-month resistance, line a, last month and made new highs last week at $34.10.
- So far, XLK has been range bound in November and is not far below the quarterly R2 resistance at $34.24.
- The daily starc+ band is at $34.50 with the weekly at $34.86.
- The daily relative performance bottomed in July and then made much higher lows in October.
- The RS line overcame daily resistance, line b, two weeks ago while the weekly RS analysis also appears to have bottomed.
- The daily OBV surged in July and has formed a pattern of higher highs and higher lows.
- The OBV has just closed back above its rising WMA.
- There is initial support now at $33.35-$33.50 and the daily starc- band.
- The quarterly pivot is at $31.95.
AT&T, Inc. (T) broke through resistance, line d, at the end of October but has since corrected sharply. In early November, one article pointed out that it was one of the least favorite stocks in both the Dow Industrials and the S&P 500. It has a current yield of 5.12%.
- The daily starc- band and the quarterly pivot at $34.52 were tested last week.
- There is even stronger support in the $34 area with the recent low at $33.09.
- The daily relative performance rose sharply last month as it moved through resistance at line g, but has since dropped below its WMA.
- The weekly RS line (not shown) also appears to be bottoming.
- The daily OBV has been much stronger as it blasted through resistance, line h, in the middle of October.
- The weekly OBV (not shown) is above its WMA.
- There is first resistance at $35.85 (quarterly R1) and then the recent high at $36.80.
NEXT PAGE: 2 Other Top Picks
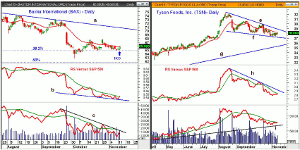
|pagebreak|Baxter International (BAX) is $35.8 billion dollar healthcare company that provides medical instruments and supplies. It has current yield of 2.97% and peaked at $74.60 in July.
- It hit a low of $62.80 in early October, which was a drop of 15.8%.
- The 38.2% Fibonacci support from the June 2012 lows was broken with the 50% support at $61.76.
- The daily chart shows that an HCD was triggered with Tuesday’s close.
- The daily relative performance still shows lower lows, line c, but is just barely below its WMA.
- The OBV did make new lows last week and it close to its downtrend, line d.
- There is near-term resistance at $66.60-$67.75 with the quarterly pivot at $68.52.
- The daily downtrend, line a, is now at $70.86.
Tyson Foods, Inc. (TSN) is part of the consumer staples sector and reports its earnings on November 18. Last month, there was a 62% increase in its short interest.
- The chart shows a flag formation (lines e and f), which is a typical continuation pattern.
- The support from last July, line f, in the $27.50 area has been tested.
- There is stronger support in the $27.25 area.
- TSN has been in a tight range, so far in November, and is currently 13.4% below the August high of $32.40.
- TSN is below the quarterly pivot at $28.94 with further resistance at $29.80-$30.
- The relative performance is barely above its WMA but still below its downtrend, line h.
- The daily OBV did confirm the high and has pulled back to long-term support at line i.
What It Means: All three of these stocks are trading well below their recent highs and show technical readings that suggest they are bottoming. Without strong new daily buy signals, the risk is higher but tight stops can be used. Both AT&T, Inc. (T) and Baxter International (BAX) have attractive yields.
How to Profit: For AT&T, Inc. (T), go 50% long at $34.92 and 50% at $34.54, with a stop at $33.47 (risk of approx. 3.6%).
For Baxter International (BAX), go 50% long at $65.71 and 50% at $65.34, with a stop at $64.23 (risk of approx. 2%).
For Tyson Foods, Inc. (TSN), go 50% long at $27.92 and 50% at $27.34, with a stop at $26.73 (risk of approx. 3.2%).
Portfolio Update: Should be long the Sector Select Technology (XLK) from $31.58 with a stop at $31.77.
Editor’s Note: If you’d like to learn more about technical analysis, attend Tom Aspray’s workshop at The Traders Expo Las Vegas, November 20-23, 2013. You can sign up here, it’s free.


