
Although it might appear counter-intuitive at first glance, MoneyShow’s Tom Aspray thinks the current market pullback might ultimately be good for the bull market’s health in the long run.
What a difference a month makes as last week’s dismal stock market performance turned into a rout on Monday and it only took a weak ISM Manufacturing Report and weak auto sales to push stocks over the cliff.
There were signs just a few weeks ago that the sentiment was souring as edgy bulls were becoming impatient with the market’s lackluster performance in early 2014. Now, we are starting to see a spike in bearish sentiment, which I think will end up being a positive for investors.
I would expect to see even more bears come out of hibernation over the next few weeks but some of these same bears were also looking for a major collapse near last summer’s lows. As the downside targets continue to drop for the S&P 500, it will help keep new investors on the sidelines and spook some nervous bulls into giving up on the market.
That does not mean that selling is necessarily a bad idea for investors or traders but it needs to be done on a case by case basis. Losses on any one position must be limited and that is why stops are important as there is no way to justify turning a 5% loser into a 15% loss.
With Tokyo taking another 4% hit overnight, the worst is not over especially with the Friday’s jobs report looming over the market. There are several signs that the market is now less risky as only 25.2% of the S&P 500 stocks are now above their 50-day MAs as compared to 79.9% at the end of 2013. Other measures of the market’s internal health show that is no longer overbought.
The heavy selling Monday makes a sharp rally likely in the next few days, so traders on the short side should be taking profits on weakness. A very sharp rally will be a sign that the market is closer to a bottom while an anemic bounce will set the stage for another wave of selling.
Investors should be identifying the stocks or sector ETFs they want to buy and at what levels the risk on new long positions can be well controlled. Let’s look at the markets.
Click to Enlarge
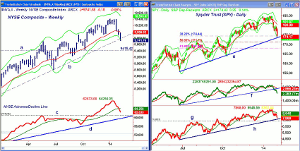
Chart Analysis: The weekly chart of the NYSE Composite shows that it closed below the weekly starc- band on Monday.
- This last occurred on May 18, 2012 when the market sentiment was also getting quite negative. Stocks bottomed four weeks later.
- In August 2011, a similar oversold reading was followed by four weeks of consolidation before another wave of selling into the October 2011 lows.
- The uptrend, line b, has been broken with next good support at 9415 (line a).
- This is 3.3% below current levels and is 9.5% below the late December high.
- The weekly NYSE Advance/Decline did make a new high with prices and has now dropped below its WMA.
- There is next good support at the April highs, line c.
- Even more important support is at the uptrend, line d, that goes back to the 2012 lows.
- The quarterly pivot is at 10.082 with the declining 20-day EMA at 10,121.
- The McClellan oscillator (not shown) has dropped to -198 but shows no signs yet of bottoming
The daily chart of the Spyder Trust (SPY) shows Monday’s plunge and the close at the daily starc- band.
- The 38.2% Fibonacci support from the June 2013 low at $174.44 was exceeded.
- The daily uptrend, line e, has also now been reached with the 50% support at $171.19.
- The break of the November 2013 lows has gotten the market’s attention.
- The daily on-balance volume (OBV) did not make a new high in January and has now dropped below the uptrend, line f.
- The weekly OBV (not shown) did confirm the recent highs but has now dropped below its WMA.
- The daily S&P 500 A/D line did make a new high with prices before dropping below its WMA.
- The next support for the A/D line is at the uptrend (line h) and then at line g.
- SPY is now trading well below the quarterly pivot at $177.97 is first strong resistance.
- The declining 20-day EMA is at $180.37
NEXT PAGE: 2 ETFs to Watch
|pagebreak|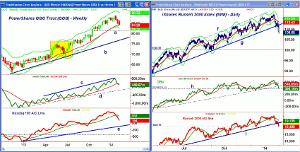
Click to Enlarge
The PowerShares QQQ Trust (QQQ) is now down 5.3% from the highs as it lost 2.3% in Monday’s session closing just above the quarterly pivot at $84.09.
- The weekly chart shows that the 20-day EMA is being tested with the weekly starc- band at $82.72.
- The next good support is in the $81.30 area, line a.
- The longer-term uptrend, line b, is in the $76.30 area.
- On the weekly chart, I have highlighted the six-week correction that occurred in the spring of 2013.
- The weekly OBV did confirm the recent highs (line a) as was also the case last spring.
- The OBV looks ready to drop below its WMA this week with more important support at line d.
- The weekly Nasdaq 100 A/D line peaked ahead of prices in late December and then dropped below its WMA last week.
- The A/D line is already back to support from last summer’s highs with the uptrend (line e) still much lower.
- There is initial resistance now at $86-$86.60 along with the 20-day EMA.
The iShares Russell 200 Index (IWM) was hit hard Monday, closing down 3.3% as the daily uptrend, line g, was decisively broken.
- There is next support at $107 and the November correction lows.
- The August highs in the $105.35-$105.63 area should provide further support.
- The close was below the daily starc- band with the weekly at $107.35.
- The daily OBV did make new highs in January before dropping back below its WMA.
- The daily uptrend in the OBV has now been broken and next support, line h, has been reached.
- The weekly OBV (not shown) has now dropped below its WMA.
- The Russell 2000 A/D has also violated its support at line i but has reached next good support.
- The quarterly pivot at $111.44 now represents first strong resistance with further at $113-$113.65.
What It Means: Though some observers are still reporting a level of complacency amongst investors, the price action suggests to me there is more panic in the markets. My analysis does not indicate that a major top has formed and that the current decline should be a buying opportunity. Some of the most overbought Dow stocks show superior relative performance and continue to look attractive at lower levels.
It is of course possible that it will be a deeper and longer correction than I am expecting but that, I think, will require a more extensive top formation.
How to Profit: As I have been recommending since the Martin Luther King holiday, you should continue to take a Take a Proactive Portfolio Approach. This means have your plan and stops in place instead of reacting to the market action.


