
Despite the fact that the market is taking a break today for the Martin Luther King, Jr. holiday, MoneyShow’s Tom Aspray thinks it’s still the perfect time to actively take stock of the holdings in your own portfolio and keep an eye out for warning signs.
The stock market seemed to be bombarded last week by earnings and economic reports, so Monday’s US market holiday should be a relief for many investors. The news overnight from China reported that their GDP grew at a lower than expected rate of 7.7%. This depressed some of the Asian markets, while the Euro indices are showing little change.
The pervasive bullishness of late 2013 seems to have been dampened by the sideways ranges in the major averages, so far, in 2014. A further lowering of the bullish sentiment should be a positive for the stock market, but it may only come after more disappointing earnings reports or new concerns over the global economy.
The relatively high level of market risk means that it is not the time to be complacent, as one should continue to be diligent in monitoring their portfolio holdings. This means tightening stops and reducing the size of the positions that you have in stocks that are deteriorating technically. For the market averages and key ETFs, I suggest you closely monitor the quarterly pivot levels discussed last week.
Two of these four stocks show very positive patterns, while the other two illustrate the type of warning signs that investors should be watching for.
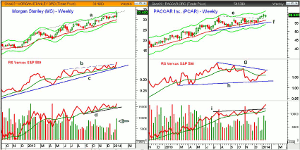
Click to Enlarge
Chart Analysis: Morgan Stanley (MS) was the big bank winner last week, as it is up 8.2% since January 14, as its earnings beat estimates.
- The weekly chart shows the strong close last week as MS did break out above resistance at line a.
- The weekly starc+ band is at $34.16, with the monthly at $35.48, which is quite close to the quarterly projected resistance at $35.35.
- The weekly relative performance has also broken out to the upside, as the resistance at line b was overcome.
- The RS line has tested its WMA over the past few weeks and shows a strong uptrend, (line c).
- The weekly OBV dropped below its WMA the previous week and triggered an AOT buy signal on Friday, as volume was heavy (see arrow).
- The OBV now has good support at line d.
- There is initial support now at $30.32-$31 with the quarterly pivot at $29.86.
Paccar, Inc. (PCAR) is a transportation services stock that was one of my “3 High-Volume Pre-Holiday Picks”. It closed strong last week, which may be the start of a new rally phase.
- PCAR broke through the weekly resistance, line e, before the end of the year. The weekly starc+ band is at $62.01, with monthly projected resistance at the $62.18.-$65 area.
- The trading range, (lines e and f), has upside targets in the $64-$66 area.
- The relative performance moved back above its WMA as prices were breaking out to the upside.
- The RS line is now testing resistance at line g, and has good support at line h.
- The weekly OBV shows a strong breakout above the resistance at line i, as volume has been strong over the past two weeks.
- There is initial support now at $57.84 to $58.27 with the quarterly pivot at $57.33.
NEXT PAGE: 2 Warning Sign Stocks
|pagebreak|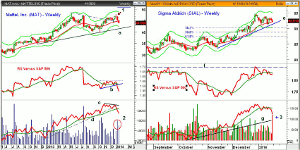
Click to Enlarge
Mattel, Inc. (MAT) hit a high on December 30, but then closed the week lower, forming a doji, (point 1). The weekly low close doji was triggered the next week.
- MAT closed the week below its 20-week EMA and the quarterly pivot at $45.07.
- The weekly starc- band is at $42.50 and additional weekly support is at $41.60.
- As MAT was making its highs, the RS analysis was showing signs of weakness in early January, as it subsequently broke support at line b.
- Both the daily and weekly RS lines are both now looking weak.
- The weekly OBV formed a negative divergence at the highs, line c, that confirmed the breakthrough support (line d) and the prior lows.
- The volume has been heavy over the past two weeks (point 2), suggesting that MAT can drop even further.
- There is resistance now in the $45-$46 area.
Sigma Aldrich (SIAL) surged above its daily starc+ band last month, as it reached a high of $95.78. It had rallied sharply from the October lows, gaining close to 15%.
- The daily uptrend, line e, is now at $91.37, with the 38.2% Fibonacci support at $90.20, which is close to the quarterly pivot at $90.50.
- The more important 50% support at $88.77 corresponds to the September highs.
- The relative performance tested resistance that goes back to early 2013, line f, before turning lower.
- The weekly RS line (not shown) shows a pattern of lower highs.
- The volume on Friday was heavy, (point 3), and the OBV has dropped further below its declining WMA.
- The weekly OBV (not shown) did confirm the highs, but is well above its rising WMA, which allows for a further decline.
- There is initial resistance at $93, and a close back above $94 is required to improve the technical outlook.
What it Means: In early January’s “Watch for Warning Signs”, I alerted investors to the deterioration I had noted in the stock of Mattel, Inc. (MAT), as well as the iShares US Energy (IYE) . Part of these positions was closed out, and, subsequently, the remaining positions were stopped out.
The current technical outlook for Sigma Aldrich (SIAL) does not warrant a full position, so part of the position should be closed out to reduce your risk. Other stops have been adjusted, and with the markets closed today, I hope you will take the time to review your own portfolios.
Of course, one does not always get good warning signs, as Capital One Financial (COF) was hit very hard last Friday in reacting to its earnings. The rest of our position was stopping out as we gave up some nice profits.
How to Profit: No new recommendation.
NEXT PAGE: The Charts in Play Portfolio
|pagebreak|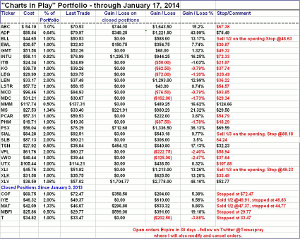
Click to Enlarge


