Crude oil prices tumbled in anticipation of a rise in crude oil stockpiles from the EIA inventories report due out today as MoneyShow’s Tom Aspray examines the technical outlook for the energy sector.
Stocks absorbed their second day of selling on Tuesday, and the futures are trading lower early Wednesday in reaction to more weak data out of China. The Asian markets were down sharply again with the Nikkei 225 losing 2.60% and the Hang Seng dropping 1.6%.
Most of the Eurozone markets are also down over 1%, but so far, the selling in the US stock index futures is not too heavy as the S&P futures are down just five points. The daily technical studies are declining but the NYSE Advance/Decline did make new highs last week and is still above its WMA.
Therefore, the current pullback is expected to be a buying opportunity as another rally is likely since a more significant top typically would take more time to form. The energy sector, which tried to rally last week, was hit with heavier selling on Tuesday. So what is the technical outlook for this key sector now?
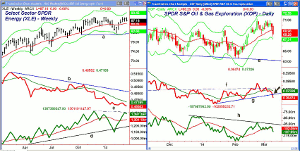
Chart Analysis: The Select Sector SPDR Energy (XLE) is down 1.53% YTD with the 20-week EMA now at $85.94 along with the monthly pivot.
- There is additionally support in the $85 area and the projected monthly pivot support at $83.46.
- In early February, XLE had a low of $81.78, line a.
- The weekly relative performance dropped below its WMA and support last October.
- The RS line is well below its WMA and the long-term downtrend, line b.
- There are no signs yet of a bottom, basis the daily RS analysis (not shown).
- The weekly on-balance volume (OBV) looks ready to turn lower after failing to exceed the previous highs, line c.
- The OBV has next support at its slightly rising WMA.
- The weekly OBV did violate a longer-term uptrend, line d, during the January-February correction.
- There is a resistance now at $88.30-$88.48 and a close above these levels is needed to reassert the uptrend.
The SPDR S&P Oil & Gas Exploration (XOP) has performed better this year as it is down just 0.35% YTD.
- XOP was down just over 2% on Tuesday with volume 1 1/2 times the average.
- Prices are now close to the daily starc- band at $67.31 with the 20-day EMA at $67.31.
- The 50% Fibonacci retracement support of the rally from the February lows is at $67.41, which is very close to the quarterly S1 support.
- The monthly projected pivot support stands at $65.15.
- The daily relative performance moved briefly above resistance at line f last week.
- The RS line has now broken its uptrend, line g, indicating that XOP is acting weaker than the S&P 500.
- The daily OBV formed lower highs in February and has now dropped below its short-term support.
NEXT PAGE: 2 Energy Stocks to Watch
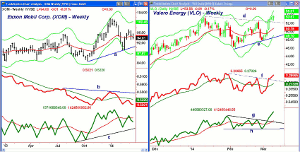
|pagebreak|Exxon Mobil Corporation (XOM), which makes up over 16% of XLE, dropped 1.5% on Tuesday. It is down 6.5% YTD and has next support at $85.94 and the 20-week EMA.
- XOM is just below the monthly pivot at $94.09 and closed below the quarterly pivot at $95.04 last Friday.
- There is further support in the $91-$92 area with the February low at $88.76.
- The pattern in the weekly relative performance looks very similar to that of XLE.
- It looks ready to make new lows this week and is well below its declining WMA.
- The weekly OBV has dropped below its WMA with support now at the February lows and the uptrend, line c.
- The daily OBV (not shown) is also below its WMA so both OBV time frames are negative.
- There is initial chart resistance at Monday’s high of $95.55 with further resistance at last Tuesday’s doji high of $96.86
Valero Energy (VLO) was recommended in late January’s One High-Octane Pick and has been one of the strongest oil and gas refining stocks. Last week, it broke through resistance at line d.
- Tuesday’s high at $53.92 tested the daily starc+ band, which is now at $55.07.
- The 127.2% Fibonacci retracement target is at $55.55 with the weekly starc+ band at $57.34.
- The daily relative performance has been very strong over the past week as it has surged above its downtrend, line f.
- The weekly RS line (not shown) is close to its previous highs.
- The daily OBV confirmed the price action as it broke out of its trading range, lines g and h.
- The weekly OBV is also above its WMA but is still slightly below the early-2014 high.
- There is initial support now in the $51.80-$52.20 area with stronger at $50.
- The monthly pivot is at $48.78 with the quarterly at $44.43.
What It Means: The failure of the energy sector to rally with crude oil, which typically bottoms in February, has kept me from making many recommendations in this sector.
The technicals suggest that a further drop is likely as the RS analysis is leading prices lower. Our long position in Valero Energy (VLO) is up over 11% in six weeks, so it is time to take some partial profits and as I tweeted “sell 1/3 of the position in VLO on the opening.”
How to Profit: No new recommendation
Portfolio Update: Should be 100% long Valero Energy (VLO) at an average price of $48.11. Sell 1/3 on the opening and raise the stop to $48.66 on the remaining position.
Also still 1/3 long Schlumberger (SLB) from $87.13 as I reduced the positions just before it popped to the upside. Use a stop now at $89.23.


