The charts for a well-known Chinese Internet stock during its rapid rise—and violent fall—show textbook patterns and can teach valuable lessons about discerning market action and key price levels.
I’m seeing a lot of comments about Sina Corp. (SINA) stock, first with the run-up in share prices and now with the stellar retracement/selloff phase underway.
Let’s take a look at the current action and mix in a few important trading tips and lessons along the way.
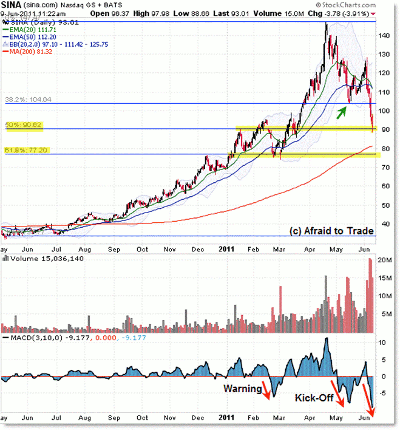
First, the bigger-picture daily chart for perspective:
Starting with mid-2010, price traded around the $40 level, which then gave way to an upside breakout trend that steadily (with the exception of February 2011) took price to all-time highs just shy of $150 per share.
There’s “trouble in paradise,” however, as shares have violently retraced, starting in April, and taking price down by 50% of the rally to where we are now, at $90.
We’ll soon see that $90 is an important reference level to watch, but for now, let’s just refer to it as the “half-way” point of the rally, or the 50% Fibonacci retracement.
NEXT: See the Classic Bear Flag Pattern and Levels to Watch
|pagebreak|For reference, the 61.8% Fibonacci retracement rests near $77.00 per share, which forms a nice confluence with the swing highs and lows along the way at that recently-tested level.
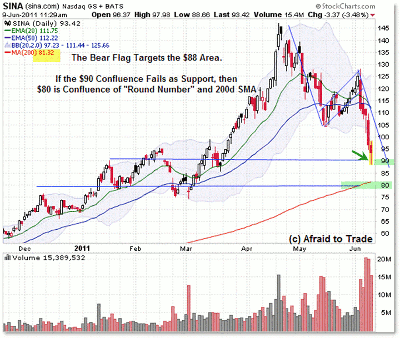
Let’s take this picture into account as we zoom in the perspective and focus on the bear flag pattern and levels to watch:
The main idea is that the $90-per-share level is both a price target that was achieved, and a potential “inflection support” point in the price structure given the nearby confluences at this level.
As with anything in technical analysis, should the $90 level fail to bring in buyers (and encourage bears/short-sellers to buy back their positions and realize their profits), then the structure opens up for a fall down to the next open confluence at $80.
Similarly, $80 per share reflects a price confluence with the 200-day simple moving average (SMA), an important reference level.
Starting with the $147 high, we observe an “impulse” move, or the “pole” of a bear flag that ended at $105. According to traditional bear flag calculations, we want to take the distance of the pole—roughly $42—and subtract that from the “flag retracement” high, which in this case is $128 per share.
Doing the quick flag math, $128 minus $42 is $86. That’s sort of in between our simple reference levels of $90 and $80, but we’ll take it as a reference.
Intraday or swing traders want to be watching the lower (intraday) charts for any major sign of upward impulse or reversal off the $90 level, or if $90 fails, look for a possible turn near $86.
Otherwise, if $86 fails, we could be in for a further selloff to $80. The same goes for short sellers looking to cover with profits.
NEXT: Important Lessons to Take from the Recent Selloff
|pagebreak|And now let’s learn a few quick trading tips using the recent selloff phase as the backdrop:
I’m all for simplicity, and this is just about as simple as it gets. Given an intraday downtrend, we often look to enter short-sale positions after a retracement up into resistance has occurred.
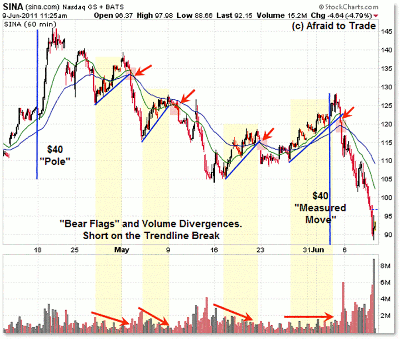
A better trigger, given that price can nip a bit through overhead resistance areas (like falling trend lines or exponential moving averages (EMAs)), is the breakdown of a rising bear-flag-style trend line that connects the lows of the retracement swing.
I’m showing four such opportunities in the context of this higher time frame retracement, three of which worked very well, and one (May 23) that didn’t.
We have similar minor (or fractal) bear flags in the context of the daily chart (higher time frame) bear flag, and the targeting (logic) is the same.
To get even more confirmation that an upswing is a retracement and not a new upward impulse, make sure to compare volume with price.
If price rises up in a suspected retracement and volume declines during the rally, then the odds are very strong that a new price low will be achieved when the retracement swing ends.
Volume declined in each of these swings, which led to a safe entry (with a stop above the most recent swing high) when price broke under the rising trend line, thus ending the retracement.
Buyers were stronger on the retracement up at the end of May, resulting in a scratch or small profit due to price not breaking back under $105.
The breakdown signal under $120 on June 3 more than made up for the prior trade. It was also the intraday entry into the daily chart potential bear flag pattern that is very near its goal today.
We can also see the daily chart bear flag more clearly when we draw the parameters (targets) on the intraday charts.
The official target is just under $90 per share, which we’ll all be watching as a potential turning point of support. If not, then expect these lower targets to be hit soon.
Always take the time to learn lessons from the charts of your favorite stocks so that you can be prepared to recognize and act on similar opportunities in the future.
By Corey Rosenbloom, trader and blogger, AfraidToTrade.com


