
TheDailyGold.com discusses key support levels in popular metals ETFs and how conditions could be right for a “massive springboard” into a new phase of the precious metals bull market..
It has been a tough year for the mining stocks. The large stocks have moved back and forth in a range from support to resistance while the mid-tiers and juniors have really struggled, especially in recent months.
With Europe seemingly on the brink and most markets turning down, it is an opportune time to examine the technical support of the various gold and silver equity indices. The longer the large-cap equities maintain support, the more internal strength they build in preparation for a breakout in early 2012. In turn, such action would greatly help the juniors and non-producers that have had a difficult year.
We start with the flagship Market Vectors Gold Miners ETF (GDX), the ETF for large, un-hedged gold producers. Since June, GDX has made slightly higher lows. Not bad considering the S&P 500, emerging markets, and commodity stocks all made news in that period.
GDX continues to hold its 600-day moving average, which was key resistance in early 2009 but support in early 2010. The market has support from $52-$54.
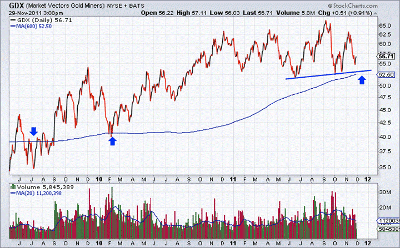
Click to Enlarge
Next is the iShares S&P/TSX Global Gold Index Fund (XGD.TO), the Canadian version of GDX/HUI. XGD provides a look at the gold stocks in Canadian dollar terms.
The chart of XGD shows little threat of the gold stocks breaking support. The market printed a low of $22 in June, but since then has held above $23. Its 600-day moving average has been support since late 2009 and currently sits at $23. A weekly close above $25 could potentially confirm that the market is on its way to testing the all-time highs.
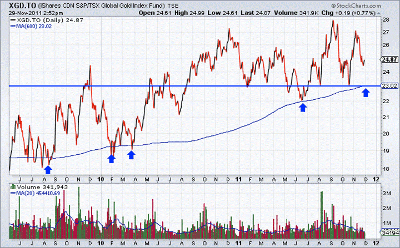
Click to Enlarge
NEXT: Junior Gold Miners, Silver Stocks Target Key Levels
|pagebreak|As we know, the juniors and non-producers have struggled, and the Market Vectors Junior Gold Miners ETF (GDXJ) broke its June low near $33 and plunged to $27. However, the market rallied to $33 and has held $27 on the initial retest. A weekly close above $28 could confirm a potential double-bottom formation.
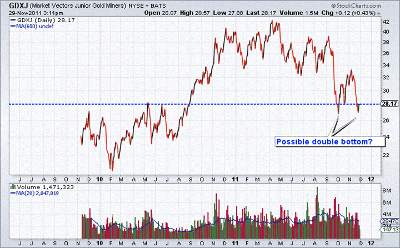
Click to Enlarge
Meanwhile, silver stocks, as tracked by the Global X Silver Miners ETF (SIL), are at a critical juncture. SIL broke below support at $22.50 but was able to hold above $20. The initial retest held.
If SIL makes a weekly close above $23, then the bottom is in. However, if the market made new lows, it would not find strong support until $16.
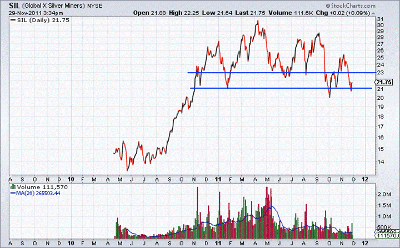
Click to Enlarge
Current and past events are frustrating and confusing some mining stock investors who are dangerously losing faith in a bull market. Gold has had a fantastic 2011, but it was no help to the mining stocks as a whole.
The potential cyclical top in equities combined with the European sovereign debt crisis has added to the malaise. However, investors forget that 2009 and 2010 were banner years for the mining stocks and that a sharp correction or long consolidation is normal after fantastic performance.
The reality is that mining stocks are sitting pretty for savvy investors. The large caps continue to hold support in a very bullish consolidation while the more speculative, quality companies improve their prospects and enhance their value as share prices stagnate.
Record metal prices and a lack of cost pressures (unlike 2007-2008) have yielded terrific cash flow and earnings for producers. These companies continue to trade near record-low valuations and remain under-owned by both institutional and retail players.
Combined with potential massive action from the European Central Bank (ECB), China, and the Fed, we could be looking at a massive springboard into the next phase of the precious metals bull market.
By Jordan Roy-Byrne, CMT, of TheDailyGold.com


