Trading trend reversals can be enormously profitable, but also fraught with danger. Online Trading Academy trading instructor, Brandon Wendell, details how he identifies when and where a morning reversal might occur, thus reducing the element of surprise.
In our professional trader courses at Online Trading Academy, we teach our students to stay away from the danger zones of the market. One of these danger zones includes the opening 15-20 minutes of the trading day. There is a saying, “Amateurs open the market and professionals close it.” The opening period (9:30 am EST to approx. 9:50 am EST), is also known as the clearing stage. This is when market makers are eager to clear the backlog of customer orders, which were placed after the market closed or before the open. The unknowing general public comes home after work and watches TV to get their financial news. They get excited about some stock that was talked about and rush to buy it. The market makers are all too happy to push the orders through in the open to capture their spread and commissions.
Those of you who have witnessed this rush will also notice the enormous amount of shares being pushed through the market. The time and sales prints are running through so fast that they are difficult to read. The quotes on the Level 2 bid and ask may also not match up with the prints. Obviously, novice traders should avoid this time if they wish to keep their capital. But when is it safe to trade? Just because the prints slow down and match the quotes doesn’t mean you are in the trend of the day.
I remember that Online Trading Academy used to have clocks, which had certain times painted red, yellow, and green denoting the times of the trading day where is was dangerous, cautionary, and good to trade. If it were only that easy! Remember that we also have the morning reversals, which can create a bit of chop. The first reversal usually occurs between 9:50 and 10:10 am EST. This is when the market makers have cleared out most of the customer orders and are ready to recoup some losses and take profits on their contra-trades. This causes a nice reversal, which may be traded. But we are talking about a 20-minute window here. When is the reversal most likely to occur?
There is a helpful guide, which may identify the turning point for the reversal. Better yet, it is free! I use the Futures vs. Fair Value to gauge at what price the market may turn. First, I identify the prior closing price of the S&P 500 Cash Index.
NEXT PAGE: Forecasting Reversals
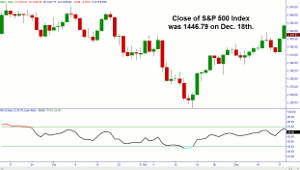
|pagebreak|In this case the close on Tuesday, December 18t was 1446.79. I then look for the Fair Value for the S&P. This is reported on CNBC, but I use the figure from www.indexarb.com.
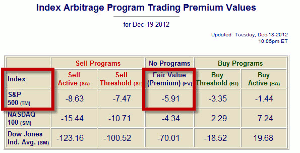
For Wednesday, February 19, Fair Value was negative $5.91. This was a constant for the day and does not change until the close of the market. Subtracting the Fair Value from the S&P closing price yields the level at which the S&P 500 Futures contracts should be trading. If the Futures are trading above that Fair Value then the equity market tries to catch up and its market should rise at the open. This works the same on the downside when futures are below fair value, the equity market will fall to catch up. According to these calculations, the Futures should have been trading 1440.88 at 9:30 am EST.
Just before the market opens, I check the quotes on the S&P 500 Futures to see where they are actually trading. If you do not have a CME quote feed (this costs about $25 on most platforms), you can simply go to CME.com for a delayed quote, which should work for our purposes.
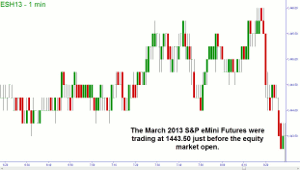
As you can see, just before the market was to open (the time shown on the futures chart is Chicago), the Futures were trading at 1443.50, well above Fair Value. If we add the fair value of $5.91 to this price, the S&P 500 should rise to about 1449.41 at the open.
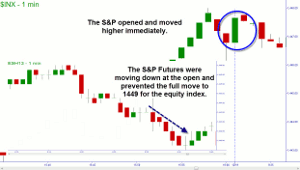
Sure enough, the market opened and the S&P rallied. It did not reach the target of 1449 since the futures moved down as well. They eventually became separated by the fair value and then continued to trend together for the day.
Right on time and target. The reversal of the S&P 500 index turned out to be the high of the day as well. This reversal can help me identify my entries or exits for gap fill trades. This is something I discuss in more detail in my professional trader courses and in the extended learning track.
I am not usually concerned with the movement if the index needs to move less than four points to reach the target. When the movement is greater, it will usually take longer than one minute to get to the target and I have better trading opportunities on the equity markets. This technique won’t work every time, but it helps me to identify when and where a morning reversal may come and thus reduce the element of surprise.
By Brandon Wendell, Trading Instructor, Online Trading Academy


